Dave Gaskell
Feb. 8, 2005
Update: Sept. 23,2005
Another update: July 13, 2007
I. Vertical Beam Position
At the beginning of the x>1/EMC Effect running, we took a series of sieve slit runs to determine the correct vertical beam position. In this case, the reconstructed value of hsxptar for the central row of sieve holes is a sensitive measure of the "absolute" vertical beam position ("absolute" in the sense that we assume that the HMS basically defines the scattering plane). In reality, the vertical beam position that gives hsxptar=0 is not the true y_beam=0 position, but it is the position consistent with central momentum and out-o-plane offsets determined in other experiments. So for all proactical purposes, it is enough to let the HMS define the appropriate vertical beam position.
For run 50130, hsxptar was -0.20 mrad. The true beam position (in spectrometer coordinates) can be calculated using:
xtar = xptar/[-1.73 (mrad/mm))] - see this link for a discussion by Henk Blok of where this comes from.
A -0.2 mrad offset indicates a vertical beam position of xtar=0.12 mm. In the "lab" where up corresponds to positive y, we have y=-0.12 mm. From the BPMs, we see that beam position using BPMs H00A and H00B projected to the target was -0.43 mm. So the projected BPM position has an offset of -0.31 mm, or,
y_beam = y [from BPMS A and B] + 0.31
This information is relevant for bounding the apparent HMS momentum offset that arises if the vertical beam position is off.
II. Horizontal Beam Position and Target Z Position (the fun way)
While we can get some sense of the horizontal beam position and the target offset along the beam from survey information, it is useful and sometimes more reliable to try to extract these values from HMS pointing and y-target reconstruction. By looking at our HMS data and tracking the hsytar shifts as a function of HMS angle, it is possible (for a thin target) to graphically reconstruct the intersection of the beam with the target.
Below is a table of hsytar for several runs - usually 1 at each angle. Each of these runs was taken on our 3% Carbon target. Each value of reconstructed hsytar has also been corrected for the HMS mispointing (see figure below). The HMS typically points between 0 and 2 mm downstream of the target, varying as a function of angle. Since the mispointing is downstream, this results in values of hsytar that are too small, so
hsytar_corrected = hsytar + HMS mispointing (downstream).
I've also listed the horizontal beam position at the target from the BPMs - this is just to show that the beam position was not moving around all that much. The spread is at most 0.33 mm.
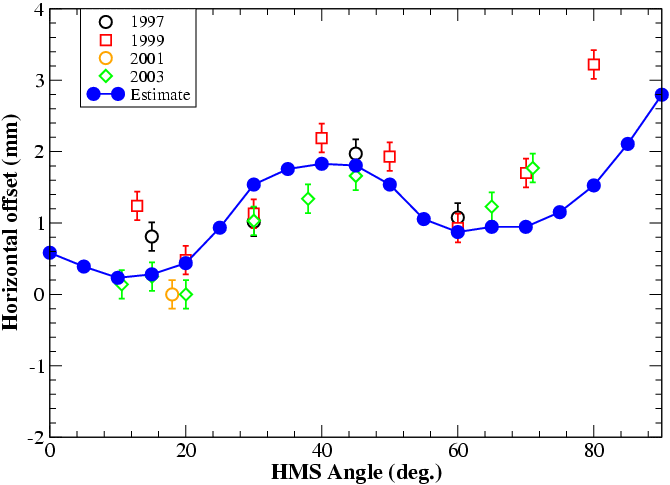
HMS pointing from survey data. The blue curve denotes a model that accounts for the weight distribution
of the HMS and flexing of the rails on the floor in Hall C.
So now comes the fun part. For each point in the table above, I simply draw a line parallel to the nominal spectrometer angle, but offset by an amount equal to the corrected ytar value. If I'm lucky, I end up with a family of lines that intersect at almost the same beam-x and z position. Below is a scanned image of my drawing.
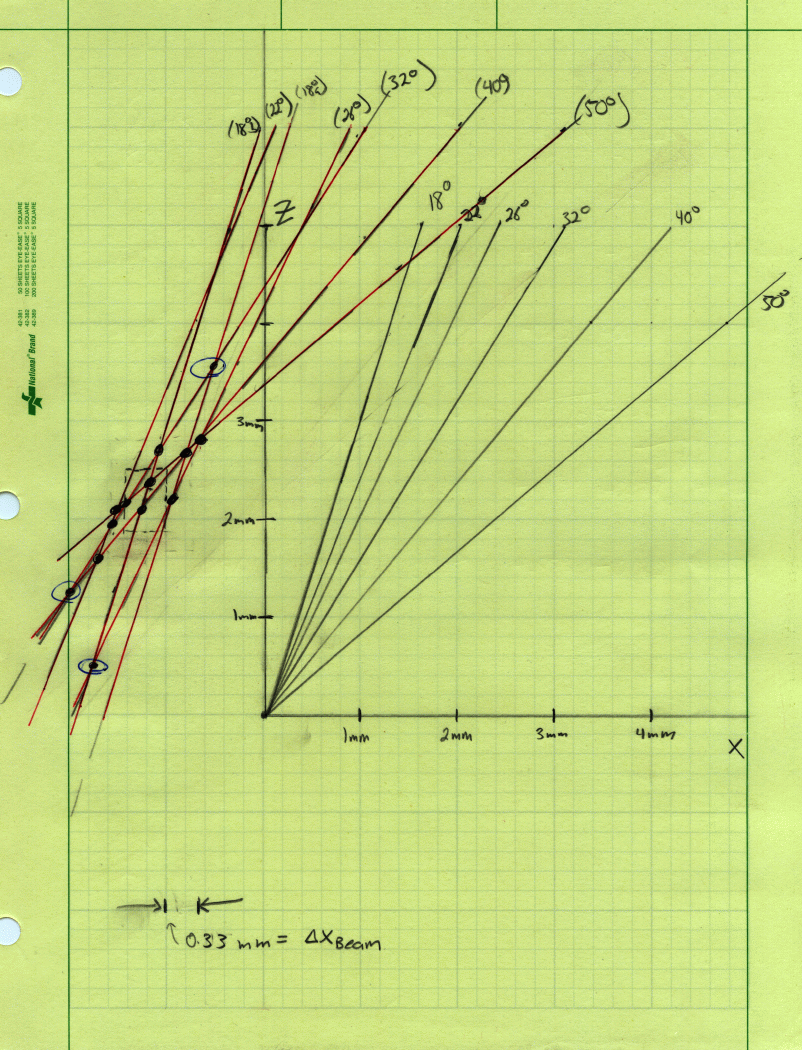
In the above, the red lines show my shifted ytar points - in parentheses I've noted which angle each line corresponds to. I've tried to mark each point where at least 2 lines intersect. As you can see, the family of intersection points clusters around x=-1 mm and z = 2-2.5 mm. The light dashed box indicates the allowed x-z space assuming a 0.1 mm uncertainty in my ytar fitting.
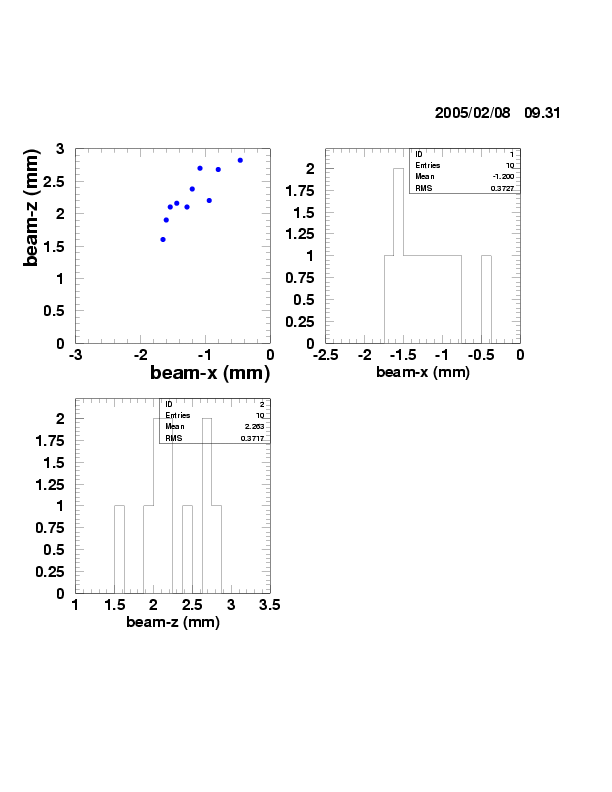
To be a bit more quantitative, I've taken the coordinates of each "reasonable" intersection point and histogrammed the x and z positions. Note that "reasonable" is somewhat arbitrary - I've thrown away the intersection point at the largest z and the 2 at the smallest z (the points enlcosed in blue circles). The histograms are shown below. For now, I suggest we take the mean and RMS as the position and uncertainty on the horizontal beam position and the z-target offset (x=-1.20 +/- 0.37 mm and z= 2.26 +/- 0.37 mm). One should note that this horizontal beam position corresponds to a value of about -0.18 mm (on average) from the BPMs. Note that in the BPM coordinate system, x is positive for beam right looking downstream, but +y is up, i.e., the coordinate system is "left-handed".
II. Horizontal Beam Position and Target Z Position (the smart way)
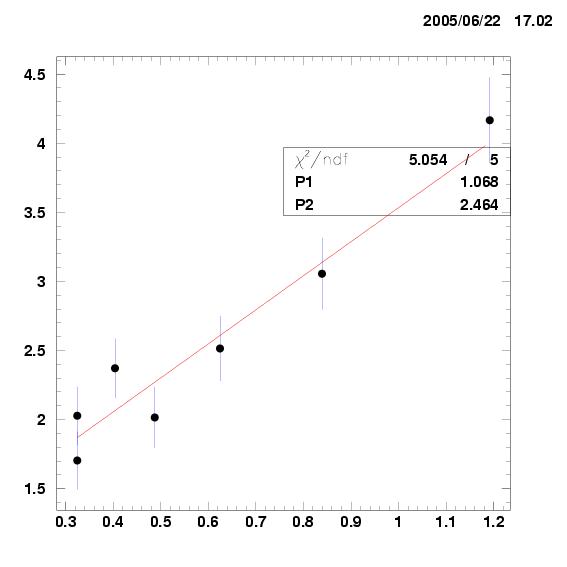
Instead of drawing pretty pictures like above, I can instead be more quantitative and use:
ytar =-x cos(theta) + z sin(theta) so
ytar/cos(theta) = -x + ztan(theta).
Plotting ytar/cos(theta) vs. tan(theta) I can extract the slope (=z) and intercept (=-x) of the resulting line (see figure below).
Using this method, I find that x=-1.1 mm (this is relative to x=-0.18 mm on the BPMs) and z=2.5 mm.
III. Target Position
A final note on the target position. In theory, the horizontal beam and target offset don't affect much when we are dealing with the solid targets. However, since the cryotargets are in curved "tuna" cans, a beam and/or target offset will impact the effective target length as seen by the beam. From the survey data, we know the targets had almost no horizontal offset before cooldown. Meekins tells me that the targets typically move about 2 mm beam right (looking dowsntream) after cooling. Combining this with our 1.1 mm beam offset (to the left), this means we were about 3.1 mm off the center of the cryotargets (typically).
However, the 2 mm shift above is recorded from our summer cooldown - the movement was not recorded during the fall. In the past (i.e. during Fpi-2) we have seen shifts as large as 4.2 mm. With this in mind I think it is prudent to assume something like 2.5-3 mm with a 1mm uncertainty. This would give a total offset of 3.6 to 4.1 mm.
Assuming the beam traversed the target on a chord parallel to the nominal central path, the length of target traversed by the beam is given by:
Leff = 2 sqrt(R2-dx2)
where R is the target radius and dx is the offset. In our case, the 4 cm target length is reduced to 3.93 cm - a change of about 1.6%. To the extent that we were able to maintain a constant beam position, this should not impact the cryotarget ratios, but should definitely be included in solid target to cryotarget ratios and absolute cross sections. It is left as an exercise for someone else to estimate the effect of averaging over the fast raster pattern.
Update Jul 13, 2007:
In the above discussion regarding target motion, I had included cryo motion of the target ladder, but ignored vacuum motion. For this ladder, that is typically ~ 1mm (in the same direction as the cooldown motion). So the total beam + target offset is:
dx = 1.1 mm (beam offset) + 2.5 mm (cryo motion) + 1 mm (vacuum motion) = 4.6 mm.
In addition, one has the (small) offsets noted during the intial target survey. This was included in Jason's original calculation of the cryotarget thickenesses, and Aji's subsequent followup.
At the beginning of the x>1/EMC Effect running, we took a series of sieve slit runs to determine the correct vertical beam position. In this case, the reconstructed value of hsxptar for the central row of sieve holes is a sensitive measure of the "absolute" vertical beam position ("absolute" in the sense that we assume that the HMS basically defines the scattering plane). In reality, the vertical beam position that gives hsxptar=0 is not the true y_beam=0 position, but it is the position consistent with central momentum and out-o-plane offsets determined in other experiments. So for all proactical purposes, it is enough to let the HMS define the appropriate vertical beam position.
For run 50130, hsxptar was -0.20 mrad. The true beam position (in spectrometer coordinates) can be calculated using:
xtar = xptar/[-1.73 (mrad/mm))] - see this link for a discussion by Henk Blok of where this comes from.
A -0.2 mrad offset indicates a vertical beam position of xtar=0.12 mm. In the "lab" where up corresponds to positive y, we have y=-0.12 mm. From the BPMs, we see that beam position using BPMs H00A and H00B projected to the target was -0.43 mm. So the projected BPM position has an offset of -0.31 mm, or,
y_beam = y [from BPMS A and B] + 0.31
This information is relevant for bounding the apparent HMS momentum offset that arises if the vertical beam position is off.
II. Horizontal Beam Position and Target Z Position (the fun way)
While we can get some sense of the horizontal beam position and the target offset along the beam from survey information, it is useful and sometimes more reliable to try to extract these values from HMS pointing and y-target reconstruction. By looking at our HMS data and tracking the hsytar shifts as a function of HMS angle, it is possible (for a thin target) to graphically reconstruct the intersection of the beam with the target.
Below is a table of hsytar for several runs - usually 1 at each angle. Each of these runs was taken on our 3% Carbon target. Each value of reconstructed hsytar has also been corrected for the HMS mispointing (see figure below). The HMS typically points between 0 and 2 mm downstream of the target, varying as a function of angle. Since the mispointing is downstream, this results in values of hsytar that are too small, so
hsytar_corrected = hsytar + HMS mispointing (downstream).
I've also listed the horizontal beam position at the target from the BPMs - this is just to show that the beam position was not moving around all that much. The spread is at most 0.33 mm.
| HMS Angle (deg.) |
PHMS
(GeV) |
Run |
Ytar
(mm) |
Mis-pointing
(mm) |
Corrected Ytar
(mm) |
Horizontal
Position from BPM (mm) |
|---|---|---|---|---|---|---|
| 18.0 |
-4.37 |
51388 |
1.50 |
+0.1 |
1.60 |
-0.16 |
| 18.0 |
-3.74 |
51389 |
1.77 |
+0.1 |
1.87 |
-0.12 |
| 22.0 |
-4.02 |
51349 |
1.96 |
+0.21 |
2.17 |
-0.15 |
| 26.0 |
-3.70 |
51017 |
1.19 |
+0.62 |
1.81 |
-0.18 |
| 32.0 |
-2.06 |
51610 |
1.22 |
+1.09 |
2.31 |
-0.39 |
| 40.0 |
-1.14 |
51321 |
0.91 |
+1.43 |
2.34 |
-0.18 |
| 50.0 |
-0.86 |
51570 |
1.05 |
+1.55 |
2.60 |
-0.06 |
HMS pointing from survey data. The blue curve denotes a model that accounts for the weight distribution
of the HMS and flexing of the rails on the floor in Hall C.
So now comes the fun part. For each point in the table above, I simply draw a line parallel to the nominal spectrometer angle, but offset by an amount equal to the corrected ytar value. If I'm lucky, I end up with a family of lines that intersect at almost the same beam-x and z position. Below is a scanned image of my drawing.
In the above, the red lines show my shifted ytar points - in parentheses I've noted which angle each line corresponds to. I've tried to mark each point where at least 2 lines intersect. As you can see, the family of intersection points clusters around x=-1 mm and z = 2-2.5 mm. The light dashed box indicates the allowed x-z space assuming a 0.1 mm uncertainty in my ytar fitting.
To be a bit more quantitative, I've taken the coordinates of each "reasonable" intersection point and histogrammed the x and z positions. Note that "reasonable" is somewhat arbitrary - I've thrown away the intersection point at the largest z and the 2 at the smallest z (the points enlcosed in blue circles). The histograms are shown below. For now, I suggest we take the mean and RMS as the position and uncertainty on the horizontal beam position and the z-target offset (x=-1.20 +/- 0.37 mm and z= 2.26 +/- 0.37 mm). One should note that this horizontal beam position corresponds to a value of about -0.18 mm (on average) from the BPMs. Note that in the BPM coordinate system, x is positive for beam right looking downstream, but +y is up, i.e., the coordinate system is "left-handed".
II. Horizontal Beam Position and Target Z Position (the smart way)
Instead of drawing pretty pictures like above, I can instead be more quantitative and use:
ytar =-x cos(theta) + z sin(theta) so
ytar/cos(theta) = -x + ztan(theta).
Plotting ytar/cos(theta) vs. tan(theta) I can extract the slope (=z) and intercept (=-x) of the resulting line (see figure below).
Using this method, I find that x=-1.1 mm (this is relative to x=-0.18 mm on the BPMs) and z=2.5 mm.
III. Target Position
A final note on the target position. In theory, the horizontal beam and target offset don't affect much when we are dealing with the solid targets. However, since the cryotargets are in curved "tuna" cans, a beam and/or target offset will impact the effective target length as seen by the beam. From the survey data, we know the targets had almost no horizontal offset before cooldown. Meekins tells me that the targets typically move about 2 mm beam right (looking dowsntream) after cooling. Combining this with our 1.1 mm beam offset (to the left), this means we were about 3.1 mm off the center of the cryotargets (typically).
However, the 2 mm shift above is recorded from our summer cooldown - the movement was not recorded during the fall. In the past (i.e. during Fpi-2) we have seen shifts as large as 4.2 mm. With this in mind I think it is prudent to assume something like 2.5-3 mm with a 1mm uncertainty. This would give a total offset of 3.6 to 4.1 mm.
Assuming the beam traversed the target on a chord parallel to the nominal central path, the length of target traversed by the beam is given by:
Leff = 2 sqrt(R2-dx2)
where R is the target radius and dx is the offset. In our case, the 4 cm target length is reduced to 3.93 cm - a change of about 1.6%. To the extent that we were able to maintain a constant beam position, this should not impact the cryotarget ratios, but should definitely be included in solid target to cryotarget ratios and absolute cross sections. It is left as an exercise for someone else to estimate the effect of averaging over the fast raster pattern.
Update Jul 13, 2007:
In the above discussion regarding target motion, I had included cryo motion of the target ladder, but ignored vacuum motion. For this ladder, that is typically ~ 1mm (in the same direction as the cooldown motion). So the total beam + target offset is:
dx = 1.1 mm (beam offset) + 2.5 mm (cryo motion) + 1 mm (vacuum motion) = 4.6 mm.
In addition, one has the (small) offsets noted during the intial target survey. This was included in Jason's original calculation of the cryotarget thickenesses, and Aji's subsequent followup.