T. Horn
January, 2008
Since the design of the CDR, there have been several changes to the SHMS design. Recent changes include an increase in the lab angle to 40 degrees, and a change in the momentum acceptance to -10%<δ<+22%. The scattering chamber is designed for targets up to 50cm, but other criteria like the available cooling power at 12 GeV times may be a limiting factor.
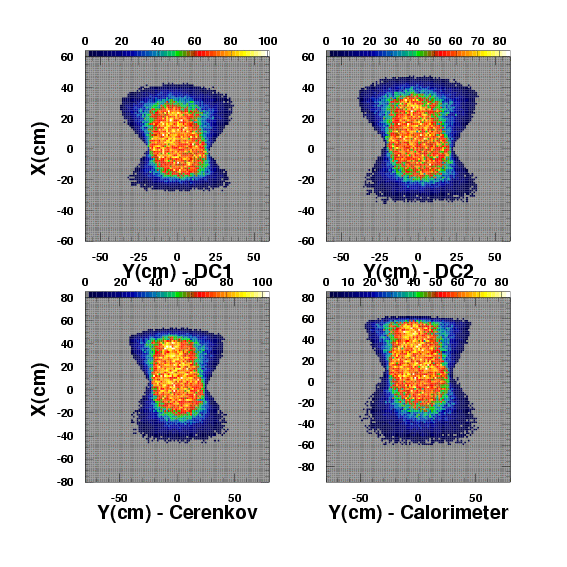
The beam envelope in the detector hut is shown in Figures 1 to 8 for a δ acceptance of -10% to +22% and the target length and angle combinations listed in the caption. The green lines indicate the detector geometry. The spectrometer optics system is used in these figures, in which +X points down and +Y is beam left. Additional target length and angle combinations are illustratd in Figures 9 and 10. For guiding the design of the detectors, the scenario illustrated in Figures 1 to 8 is appropriate as it represents the needs of the currently approved experiments like E12-06-121. The nominal parameters are z=40cm and theta=40°. The numerical values for the beam sizes at the detector locations are listed in Table 1.
Table 1: SHMS detector locations and corresponding beam sizes for 40-cm target and -10< δ <+22%. The focal plane is located at 18.1m in z from the target. All dimensions given in the table are defined relative to the focal plane (z=0). No detector cuts are included.
| Detector | Z (cm) | X (cm) | Y (cm) |
|||||||
| atm Cerenkov (front) | -310 | (-15,30) | (-30,+30) | |||||||
| atm Cerenkov (middle) | -185 | (-17,35) | (-35,+35) | |||||||
| atm Cerenkov (back) | -60 | (-25,+45) | (-40,+40) | |||||||
| DC1 | -40 | (-30,+45) | (-40,+40) | |||||||
| DC2 | +40 | (-35,+50) | (-45,+45) | |||||||
| S1 | +55 | (-40,+50) | (-45,+45) | |||||||
| C4F10 Cerenkov (front) | +70 | (-40,+50) | (-45,+45) | |||||||
| C4F10 Cerenkov (middle) | +120 | (-45,+55) | (-45,+50) | |||||||
| C4F10 Cerenkov (back) | +170 | (-50,+55) | (-45,+50) | |||||||
| S2 | +265 | (-55,+65) | (-50,+50) | |||||||
| Calorimeter (middle) | +320 | (-60,+65) | (-55,+55) | |||||||
| Calorimeter (back) | +360 | (-65,+65) | (-60,+60) | |||||||
Figure 1: The vertical X versus the horizontal Y position at the location of the noble gas Cerenkov back plane (X is vertical in the optical coordinate system). The simulation includes all the recent design changes, with cuts at -10<δ<+22% and -20< Ytar<20cm at a scattering angle of 40 degrees (z_eff=26cm).
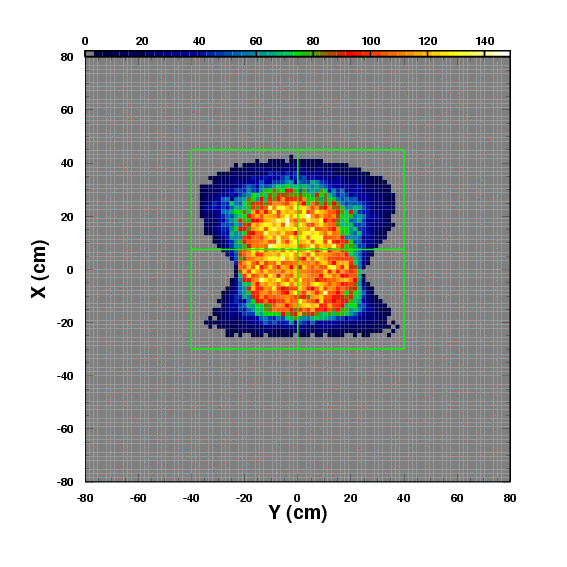
Figure 2: The vertical X versus the horizontal Y position at the location of the first drift chamber (X is vertical in the optical coordinate system). The simulation includes all the recent design changes, with cuts at -10<δ<+22% and -20< Ytar<20cm at a scattering angle of 40 degrees (z_eff=26cm).
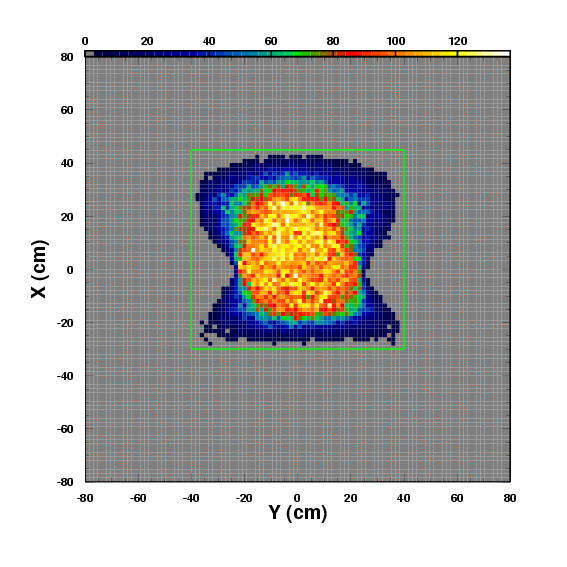
Figure 3: The vertical X versus the horizontal Y position at the location of the second drift chamber (X is vertical in the optical coordinate system). The simulation includes all the recent design changes, with cuts at -10<δ<+22% and -20< Ytar<20cm at a scattering angle of 40 degrees (z_eff=26cm).
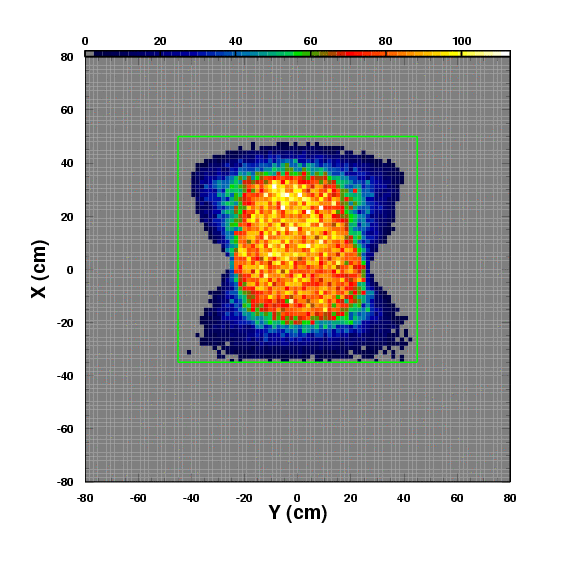
Figure 4: The vertical X versus the horizontal Y position at the location of the first hodoscope plane (X is vertical in the optical coordinate system). The simulation includes all the recent design changes, with cuts at -10<δ<+22% and -20< Ytar<20cm at a scattering angle of 40 degrees (z_eff=26cm).
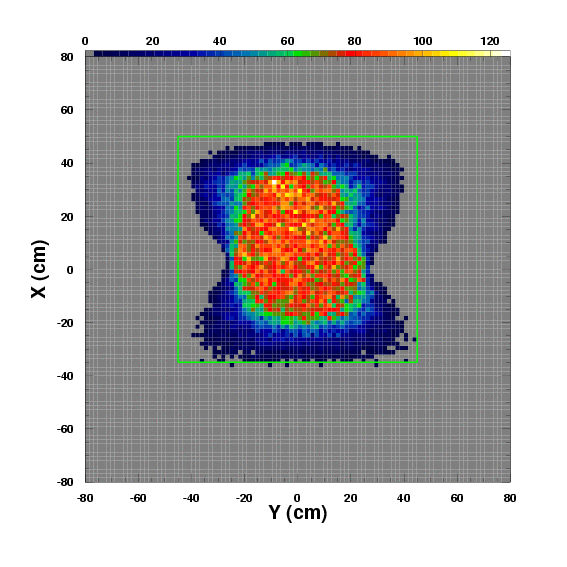
Figure 5: The vertical X versus the horizontal Y position at the location of the C4F10 Cerenkov back plane (X is vertical in the optical coordinate system). The simulation includes all the recent design changes, with cuts at -10<δ<+22% and -20< Ytar<20cm at a scattering angle of 40 degrees (z_eff=26cm).
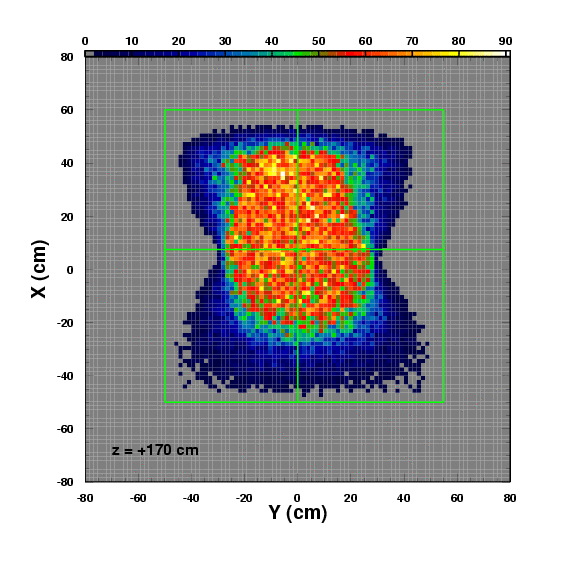
Figure 6: The vertical X versus the horizontal Y position at the location of the second hodoscope (X is vertical in the optical coordinate system). The simulation includes all the recent design changes, with cuts at -10<δ<+22% and -20< Ytar<20cm at a scattering angle of 40 degrees (z_eff=26cm).
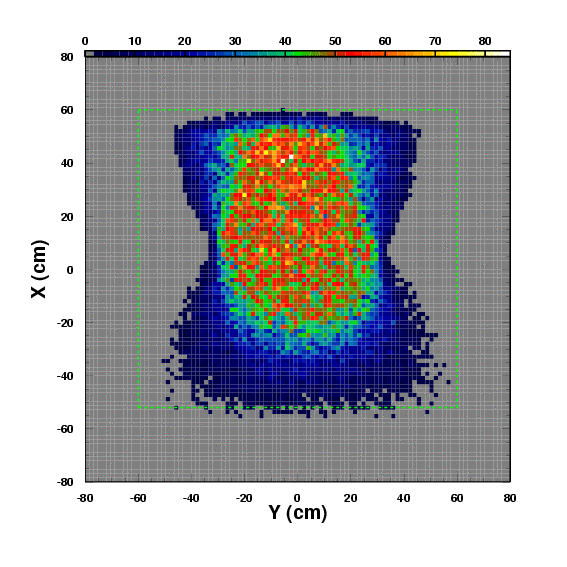
Figure 7: The vertical X versus the horizontal Y position at the location of the quartz detector (X is vertical in the optical coordinate system). The simulation includes all the recent design changes, with cuts at -10<δ<+22% and -20< Ytar<20cm at a scattering angle of 40 degrees (z_eff=26cm).
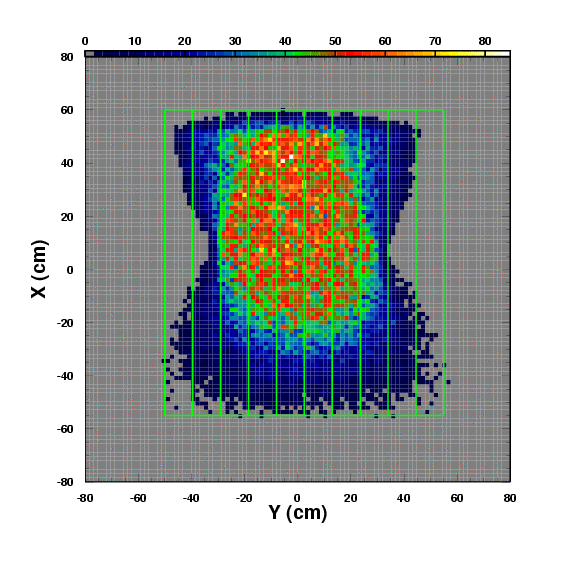
Figure 8: The vertical X versus the horizontal Y position at the location of the calorimeter back plane (X is vertical in the optical coordinate system). The simulation includes all the recent design changes, with cuts at -10<δ<+22% and -20< Ytar<20cm at a scattering angle of 40 degrees (z_eff=26cm).
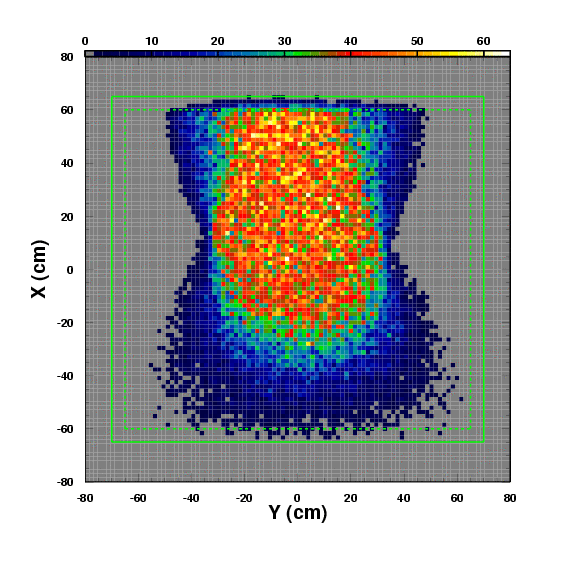
Figure 9: The vertical X versus the horizontal Y position at the detector locations (X is vertical in the optical coordinate system). The simulation includes all the recent design changes, with cuts at -10<δ<+22% and -25< Ytar<25cm at a scattering angle of 25 degrees.
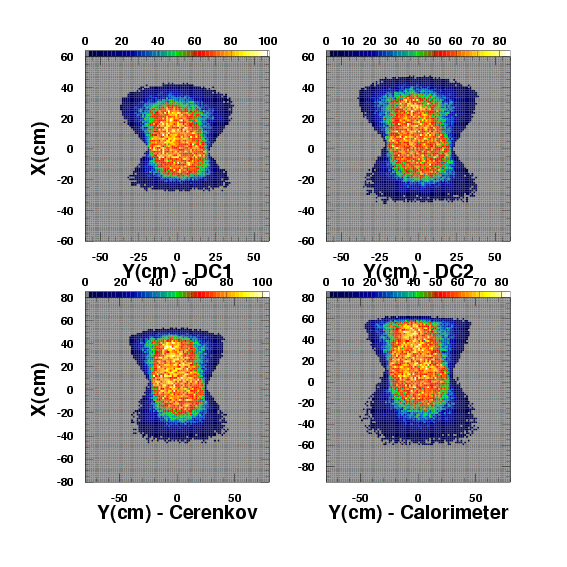
Figure 10: The vertical X versus the horizontal Y position at the detector locations (X is vertical in the optical coordinate system). The simulation includes all the recent design changes, with cuts at -10<δ<+22% and -25< Ytar<25cm at a scattering angle of 40 degrees.
