Dummy: closer look
I decided to look a little closer at the dummy yields at 18 degrees, 5.1 GeV, since they seem to decrease with time, and we have data sprinkled throughout the 3 month running period.
What goes into the charge normalized yield? Counts, charge, prescale factor, fiducial efficiency, computer dead time and electronic dead time. For cryo targets, there are other corrections, but this is a solid target.
As far as counts, I apply "standard" electron cuts:
Ntuple/Cuts $1 abs(hsdelta)<=9.0
Ntuple/Cuts $2 abs(hsxptar)<=0.07
Ntuple/Cuts $3 hcer_npe>=2
Ntuple/Cuts $4 hsshsum>=0.7
Ntuple/Cuts $5 abs(hsyptar)<=0.03
Here are the others things listed above for the aluminum runs:
run----- PS----- Q ------ Fid_Eff---- Comp.L.T.----- E.L.T--- Current ---Cur_Ave---3/4 (calc)--del_off
50190 --- 1 --- 19764.9 --- 0.959100 --- 0.893688 --- 1.000000 --- 32.4240---29.043 ---.984
50235 --- 1 --- 58901.7 --- 0.958600 --- 0.893304 --- 1.000000 --- 33.9830--- 32.750---.984
50543 --- 1 --- 42644.1 --- 0.956700 --- 0.927075 --- 1.000000 --- 33.4600--- 32.099---.984
50807 --- 1 --- 105218.2 --- 0.962400 --- 0.926563 --- 1.000000 --- 33.3190---32.855 ---.984
51378 --- 1 --- 33846.0 --- 0.969500 --- 0.940928 --- 1.000000 --- 33.8410--- 33.427---.983
51379 --- 1 --- 48277.8 --- 0.969800 --- 0.940078 --- 1.000000 --- 33.7930--- 33.561---.983
51380 --- 1 --- 13814.1 --- 0.968700 --- 0.942054 --- 1.000000 --- 33.7730---33.485 ---.984
3/4 = 0.984
3/4 = 0.984
3/4 = 0.984
3/4 = 0.984
3/4 = 0.983
3/4 = 0.983
3/4 = 0.984
The current listed above is "current-weighted", which is to say that it gives less weight to beam trips. The Cur_ave is the normal average. Note that the runs for which these noticeably disagree probably have many beam trips.
Also, here are the hELREAL rates (Hz) for these runs:
50190--- 114.3
50235--- 226.1
50543--- 191.6
50807--- 203.7
51378--- 238.5
51379--- 240.9
51380--- 239.3
The only thing seems to change with time is the computer live time, so I tried taking it out (thinking that maybe in reality it's constant, and we're not calculating it perfectly). And while that brings up the yields taken at the end of the run period, it does the same with those in the middle.
In this plot, I replot the aluminum yields *with* all the corrections described above (labeled "fully corrected"), then, I also plot them twice more, once without including the correction for the computer dead time, and again without including the correction for the fiducial efficiency.

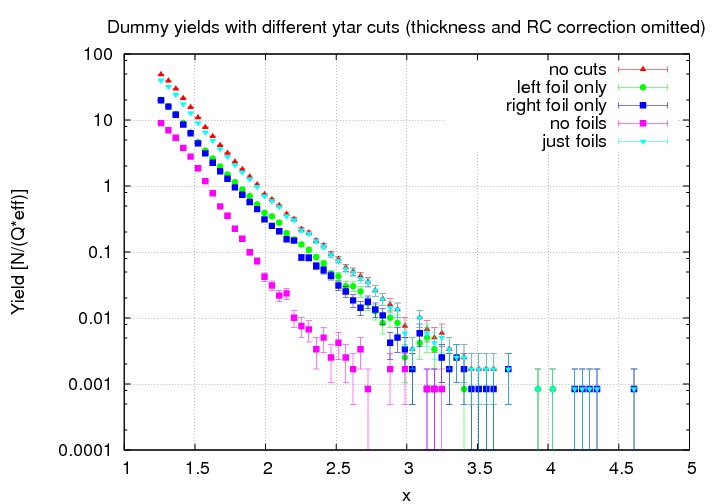
Yields with ytar cuts
I ran the code to calculate the dummy yield with 4 sets of cuts:
*left foil = -1 < ytar < -0.1
*right foil =0.1 < ytar < 0.1
*no foils = not (left or right)
*just foils = left foil || right foil
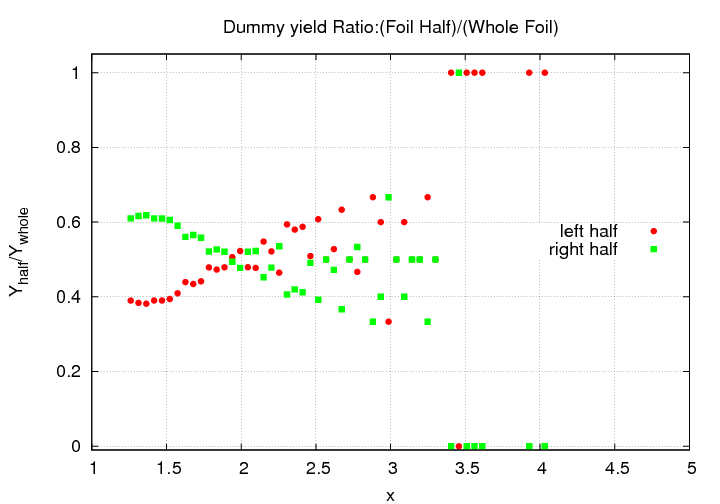
First, here are just the yields (I decided to forego the thickness and extra RC factor, since those would not be dependent on the cuts in any way). The second plot is the ratio of a yield for a given ytar cut to the yield with not cut at all. It looks like the foils either don't contribute equally, or the cuts chosen were not the best ever.

Now, looking at the left foil only (-1
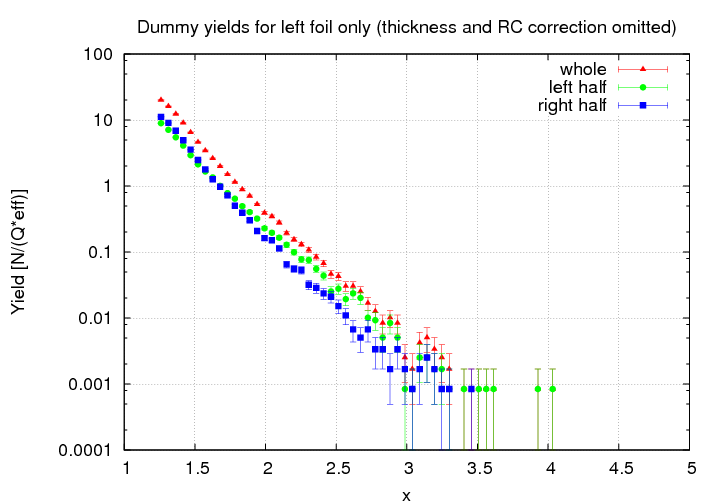

Oops, the above weren't exacly cut on the middle of the peak, so I redid it (with the middle of the peak being at ytar=-0.54, imo).

Back to Yields.