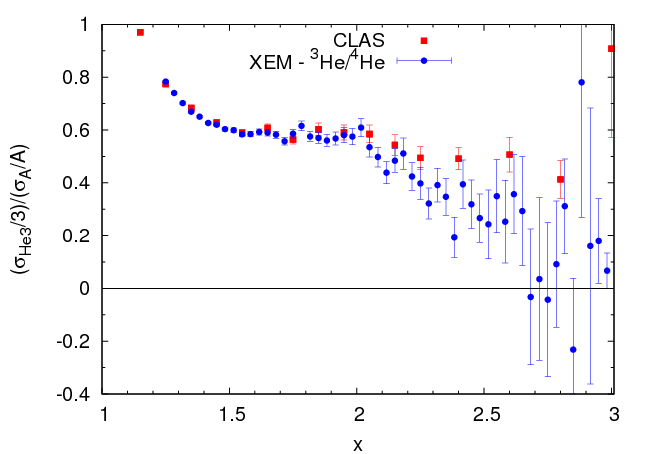
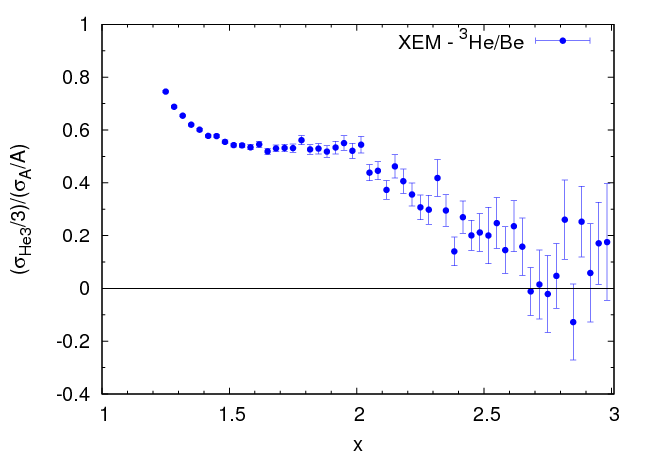
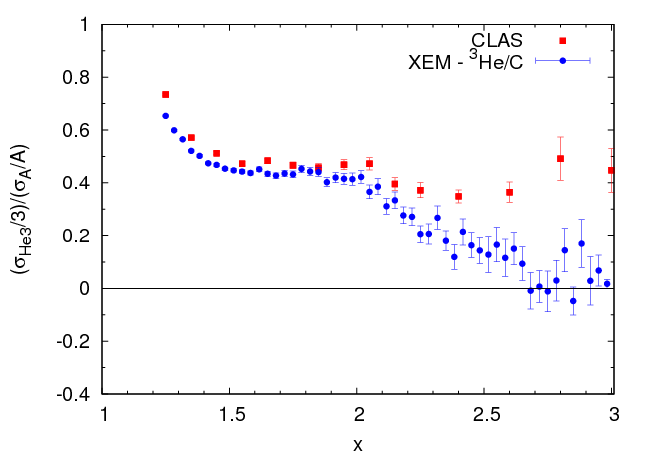
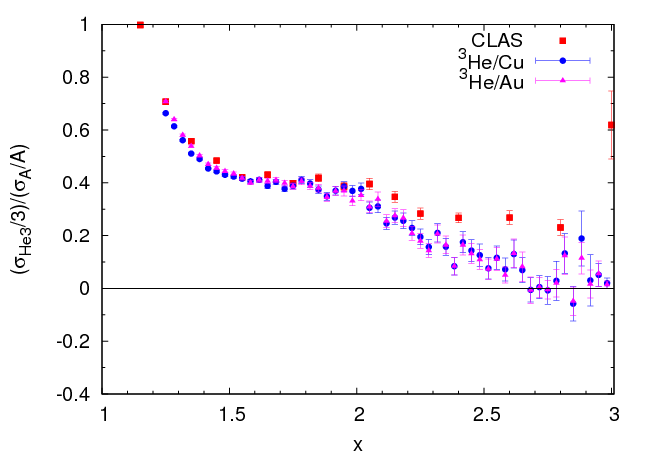
Let's check out the "new" 3He/A ratios.
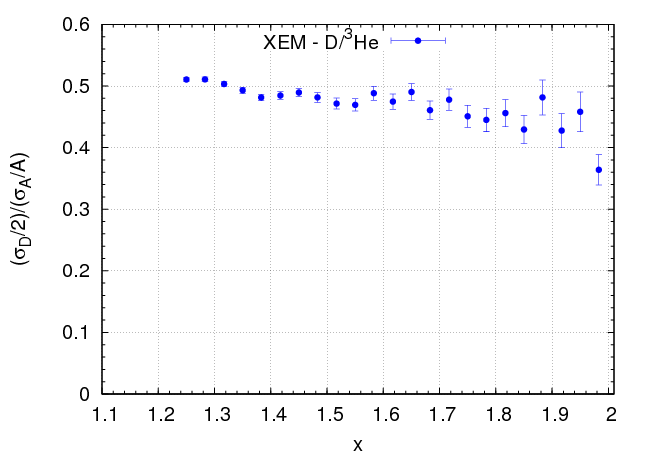
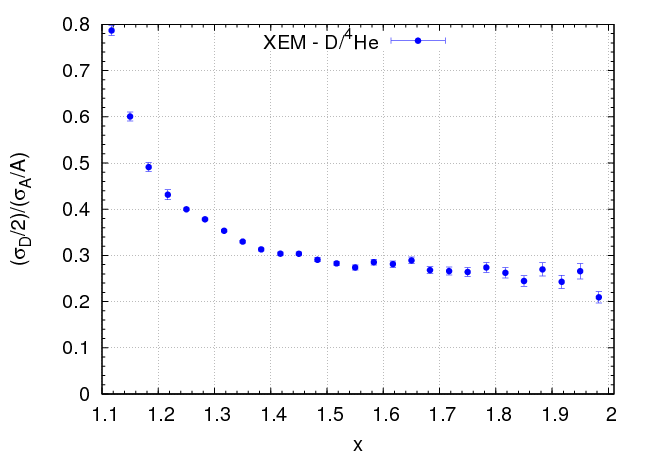
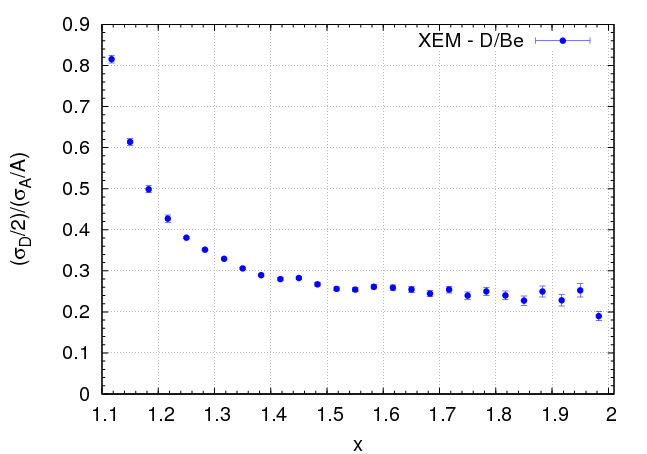
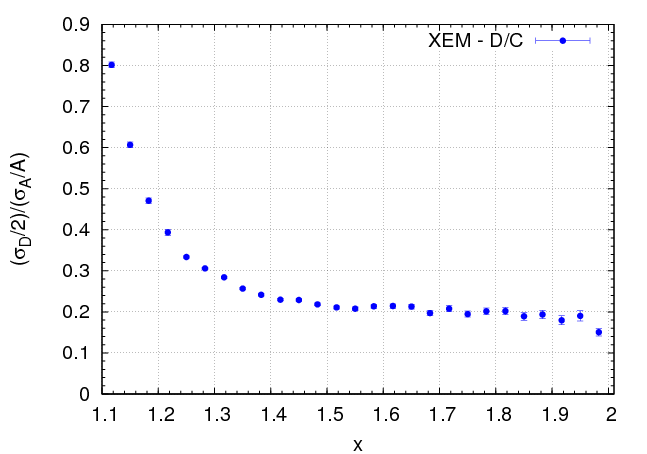
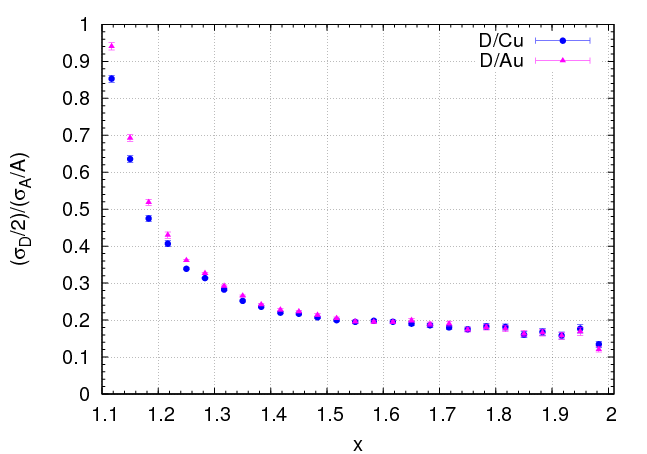
Analogous plots of D/A ratios.
Note: I noticed that I only remade the cross sections for the last HMS setting for helium-3, so the plot is empty at low x. Redoing it.
And now we extract the raw ratio in the plateau region.
Left Column: we take all the 3He/A ratios in a given x-range and perform an error-weighted average [Sum(r/err**2)/Sum(1/err**2)]
Right Column: Take the ratio of integrated cross sections. So, add up all the 3He and A cross sections for xmin< x < xmax and take the ratio. So that ratio=sum(sigma_3He)/sum(sigma_A).
3He/A ratios, 2.5<=x<=2.9
18...4....... 0.282858 +/- 0.0383896 ;...... 0.279853 +/- 0.0388049
18...9....... 0.171882 +/- 0.0241501 ;...... 0.177602 +/- 0.0242152
18...12..... 0.104055 +/- 0.01605 ;.......... 0.120187 +/- 0.0163606
18...63..... 0.0815039 +/- 0.0126408 ;.... 0.0937121 +/- 0.0127204
18...197... 0.0690352 +/- 0.0110643 ;.... 0.083503 +/- 0.0113182
3He/A ratios, 1.4<=x<=1.9
18 ... 4 ...... 0.60191 +/- 0.0025868 ;....... 0.600497 +/- 0.00260542
18 ... 9 ...... 0.553134 +/- 0.00244216 ; ... 0.551894 +/- 0.00245845
18 ... 12..... 0.452585 +/- 0.00206333 ; ... 0.451594 +/- 0.00207639
18 ... 63 .... 0.422023 +/- 0.00193609 ; ... 0.420884 +/- 0.00194513
18 ... 197 .. 0.430087 +/- 0.00200943 ; ... 0.429117 +/- 0.00201801
3He/A ratios, 1.5<=x<=1.9
18 ... 4 ...... 0.586572 +/- 0.0035996 ;..... 0.586209 +/- 0.00362241
18 ... 9 ...... 0.536614 +/- 0.00337483 ; ..... 0.536383 +/- 0.00339618
18 ... 12..... 0.439975 +/- 0.00285449 ; .... 0.439711 +/- 0.00287086
18 ... 63 .... 0.403576 +/- 0.00262532 ; .... 0.402938 +/- 0.002636
18 ... 197 .. 0.407876 +/- 0.00269401 ; .... 0.407187 +/- 0.00270391
D/A ratios, 1.5<=x<=1.9
18... 3 ...... 0.470852 +/- 0.00405132 ; 0.470537 +/- 0.00407722
18... 4 ..... 0.276266 +/- 0.00214995 ; 0.275833 +/- 0.00216066
18... 9 ..... 0.252777 +/- 0.00199745 ; 0.252388 +/- 0.00200747
18... 12 ... 0.207221 +/- 0.0016707 ; 0.206901 +/- 0.00167835
18... 63 ... 0.190045 +/- 0.00153549 ; 0.189597 +/- 0.00153997
18... 197 ... 0.192015 +/- 0.00156732 ; 0.191596 +/- 0.00157145
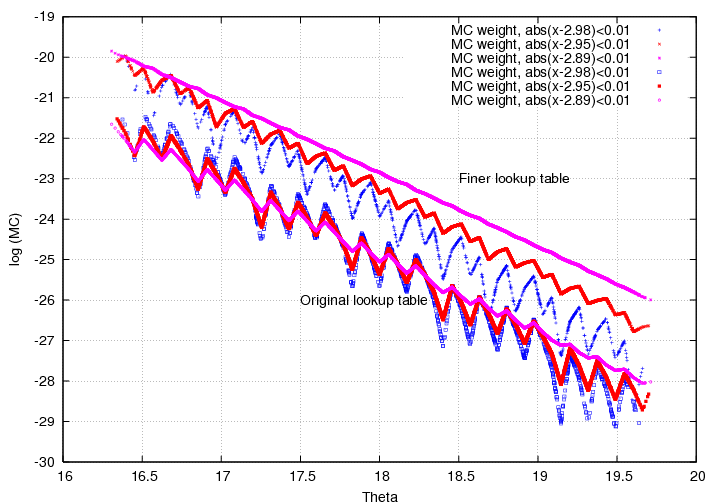
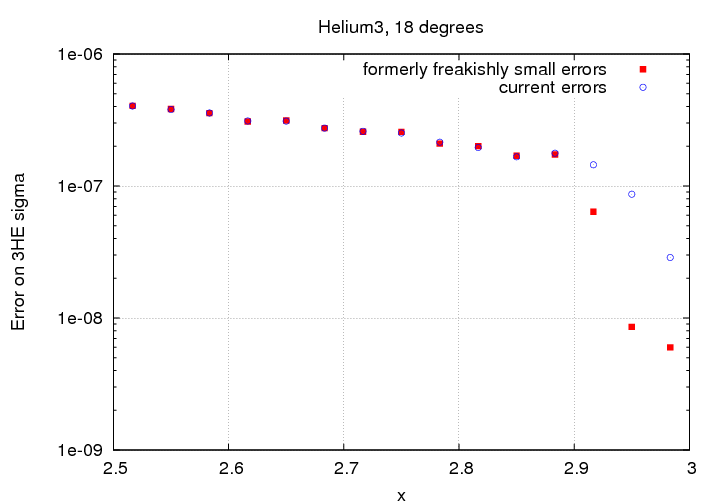
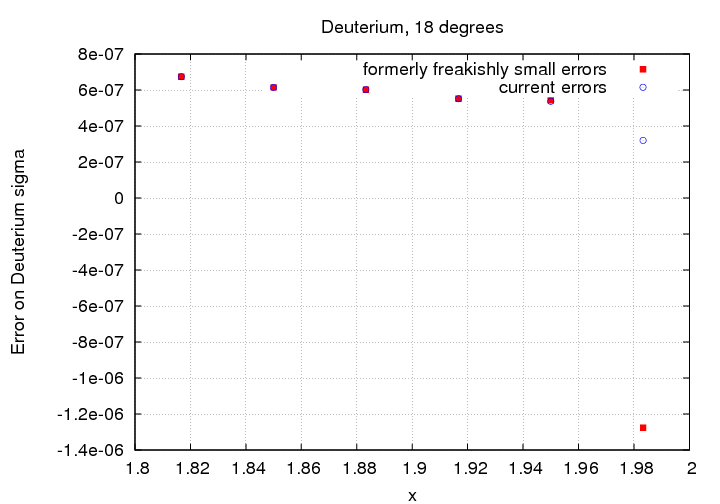
As part of the investigation into x>2.9 points, we loooked at the MC yield for a fixed x-value as a function of theta and noticed that it got weird near x-->A. It was my belief that there were two things that were conspiring to do this: model going to zero and large x-bins in the lookup table. To get a value out of the Y_MC lookup table (in x,theta), my code picks the 4-nearest neighbors and does an interpolation (or rather 2 of them). They used to be linear, but now they're exponential. When we're near x-->A, one, or more of the 4 lookup points can be zero (before it should be). What we try to do then is instead of interpolating between the nearest neighbors, we go from nearest non-zero neighbors to 0 at x=3. The model goes to zero noticeably before x=3. So, we have to do this "far" interpolation for data in the last several bins (the closer to 3, the larger fraction of the points that's affected). This is what I think I was making the wiggles. The lookup table is uniform in E' and theta, which obviously means the x-bins get bigger and bigger as you go to x-->A. That doesn't help.
To test this, I spent a few days trying to get the old code that makes the lookup table work again (Jlab switched compilers after I graduated and it hasn't worked since then). I made a new lookup table for 3He and deuterium at
18...degrees only, with twice as many points in E'. This took 2 days to run. Note: the cross sections were not really affected by this (I think it averages out), but the wiggles improved: