--SRC Index
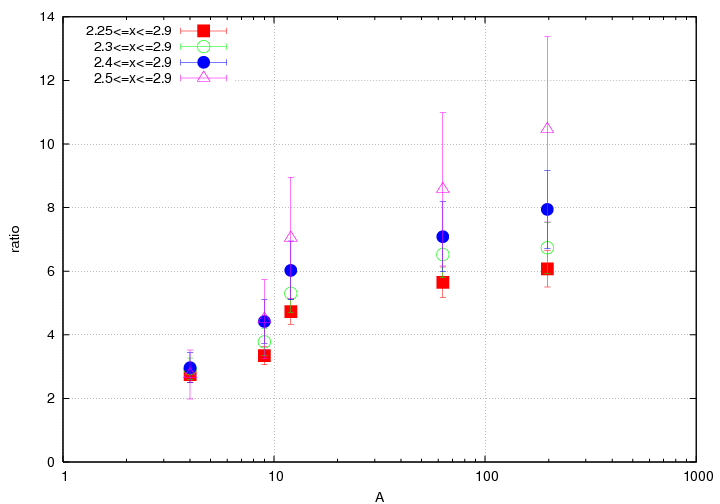
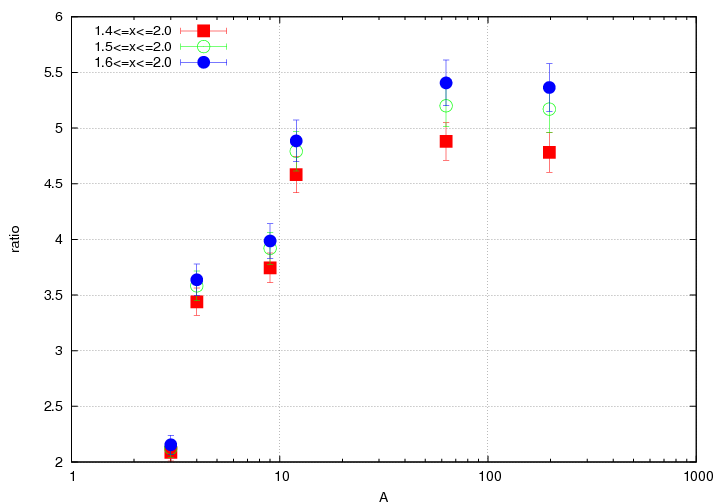
After passing around the first rought draft of the SRC paper, John suggested I share some analysis stuff. I extracted values for the plateaus with x-ranges that I'd chosen (1.4-2 for 2N, based on accepted scaling region, and 2.25-2.9 for 3N based on my own ... preference). Here, I'm going to show what the ratios look like using different x cuts for getting the plateau values.
Plotting them as a function of A seemed like the easiest way to get the information across.
2N ratios
=========================
3He
=========================