--SRC Index
Extracting n(k) for deuterium
The first plot in the current draft of the SRC paper is the F(y) for deuterium [see below], along with the calculations from various theorists. John suggested we add a nuclear matter curve, I think to convey the idea that they're parallel (although the one we have kinda sucks). Then, the conversation shifted to "why are we showing F(y), when we can show n(k)?".
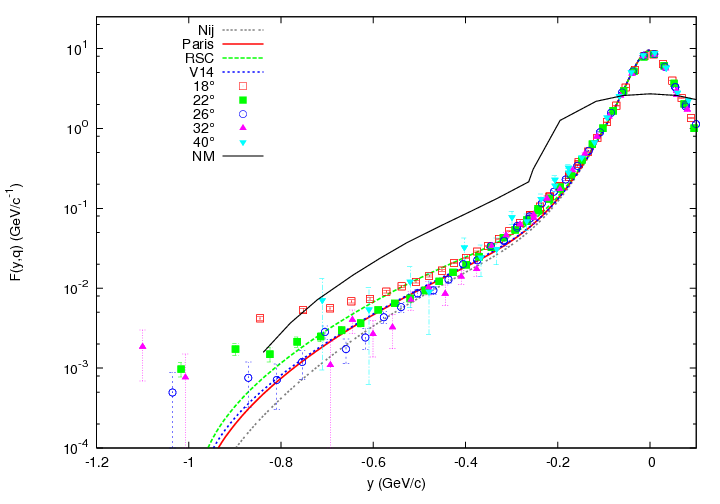
Well, the short answer is because we didn't have n(k) and I didn't feel like doing it, since I maintained that in conveyed the same information. But, skipping over the intermediate "negotiations", here we are.
How did I make this?
I took my F(y) points, 2 at a time, and fit a line between each pair. Took the slope of the line (-slope/2/pi/y) - bam, that's my n(k) at each half-way point.
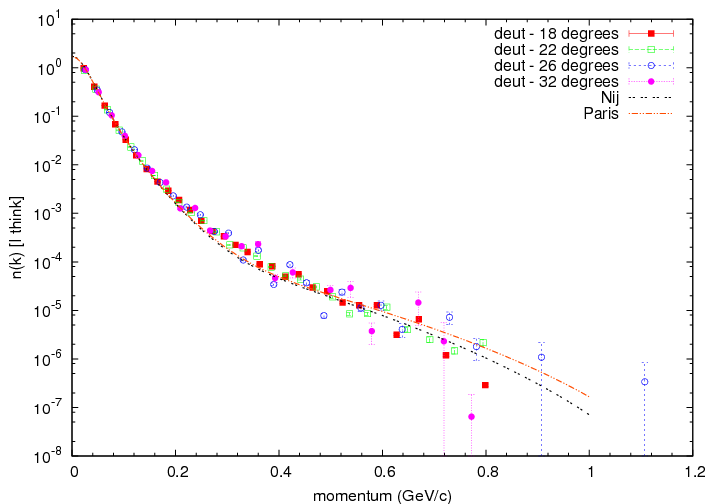
Too bad it looks so jittery in all the interesting places. It's not so strange given this method, since for large negative values of y, F(y) jumps up and down, so the slopw can easily change between consecutive pairs of points.
Attempt to fix the jitter
So, the obvious thing to do is to use more than 2 points at a time, to suppress any fluctuations. Fine, I go to 3 points, doing 1,2,3, then 2, 3,4, then, 3, 4,5, etc. The result is much improved:
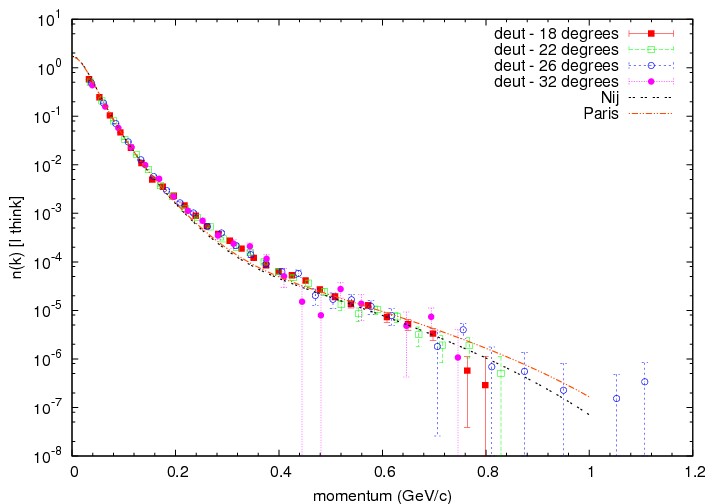
In fact, there are either NO FSI, or they're Q^2- and y- independent. Neat trick. However, fitting a straight line to 3 points is probably no longer a good approximation, so let's try doing an exponential.
Better fit
Not done