Privacy and Security Notice
Meeting No2 - Threshold Pi0 beam energy determination
Who is Jure Bericic ?
Jure is a summer student who is helping us with the beam energy analysis. He is undergraduate
student of physics at the University of Ljubljana.
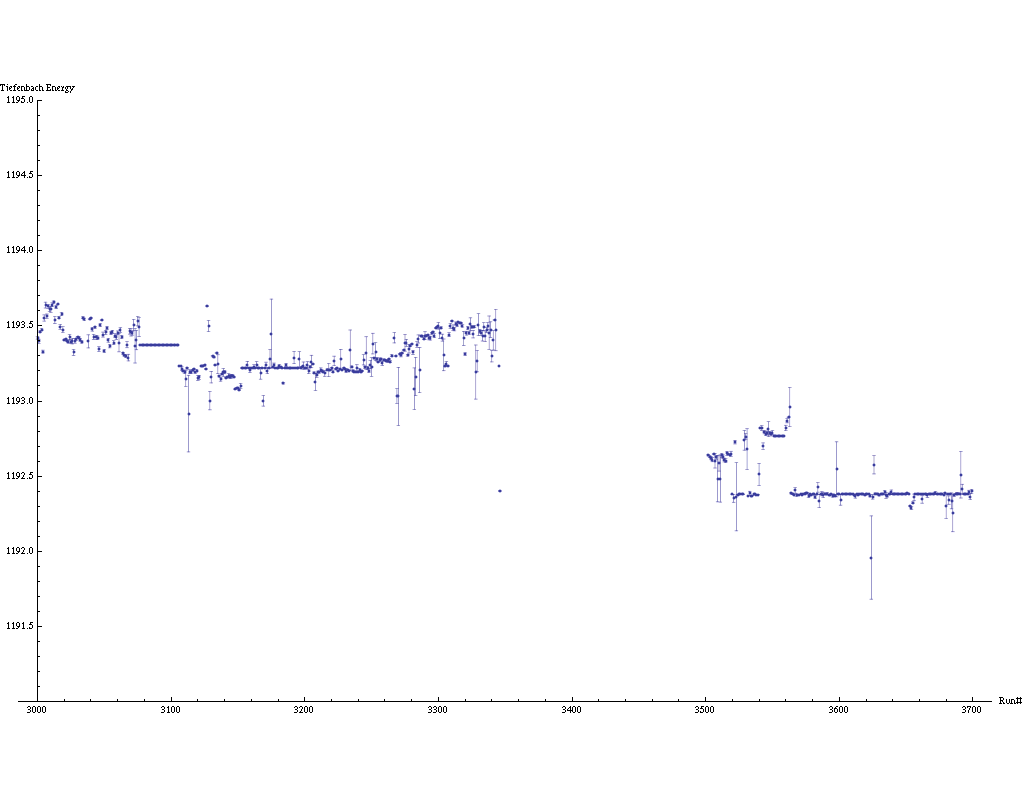
Begin-of-Run analysis
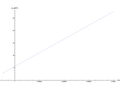
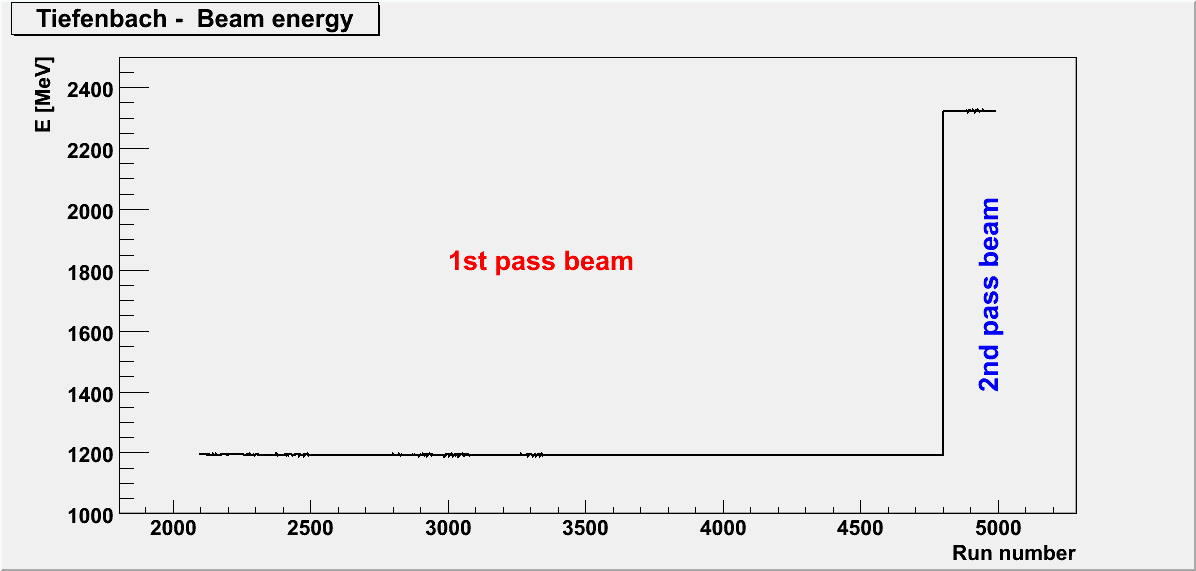
We started our analysis with the examination of the Tiefenbach values from the Begin-of-run scripts.
This has given us the first estimation of how beam energy looks like. Plots below show, how beam
energy (according to Mike Tiefenbach) changes with the run numbers.In this analysis we have
considered only left-arm runs.

Elastic run analysis
The thing that we are most interested in is, if Tiefenbach values are good estimation for the beam energy. To examine that we decided to analyze available elastic runs and compare the results with Tiefenbach values. We have three targets available: Ta, Single foil C target and Hydrogen target. From analysis of these three targets we can determine
the beam energy.
So far we have analyzed following runs:
------------------------------------------------
  Run number |  Target   |  Angle  |  P_central
================================================
   3108      |    Ta     |  14.5   |   1.19
   3109      |    Ta     |  14.5   |   1.19
   3111      |    Ta     |  14.5   |   1.19
   3112      |    12C    |  14.5   |   1.19
   3113      |    12C    |  14.5   |   1.19
   3130      |    12C    |  14.5   |   1.19
   3136      |     H     |  14.5   |   1.15
------------------------------------------------
Ta: 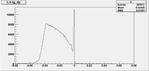 ,
12C:
,
12C:  ,
H:
,
H: 
12C -runs :
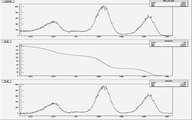
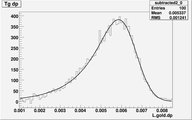
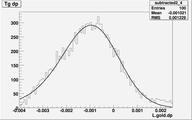
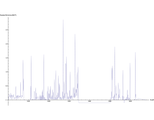
Because of the small number of counts we have joined all carbon runs ( #3112, #3113 and #3130 )
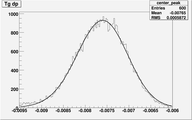
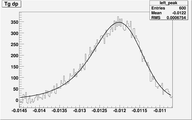
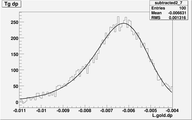
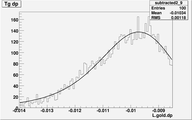
together. Following plots show delta-distributions of all three carbon peaks i.e. Elastic peak, First excited state
(4.4389MeV) and Third excited state (9.641MeV):

Fit Parameters:
Elastic peak:
---------------------------
A = 832.934
b = -0.0032807
sigma = 0.000424486
alpha = 0.00047972
max_x = -0.00359958
max_y = 628.154
dA = 0.725364
db = 4.42994e-07
dsigma = 3.45099e-07
dalpha = 7.66213e-07
---------------------------
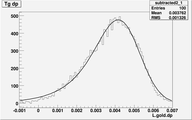
1st excited state:
---------------------------
A = 1000
b = -0.0073928
sigma = 0.000542691
alpha = 0.000236091
max_x = -0.0076007
max_y = 929.252
dA = 0.00292451
db = 3.11034e-07
dsigma = 1.03305e-07
dalpha = 3.47767e-07
---------------------------
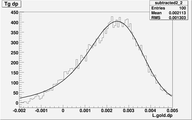
3rd excited state:
---------------------------
A = 474.236
b = -0.0116404
sigma = 0.000479661
alpha = 0.000588242
max_x = -0.0120183
max_y = 347.661
dA = 0.776922
db = 8.73291e-07
dsigma = 7.37711e-07
dalpha = 1.56138e-06
---------------------------
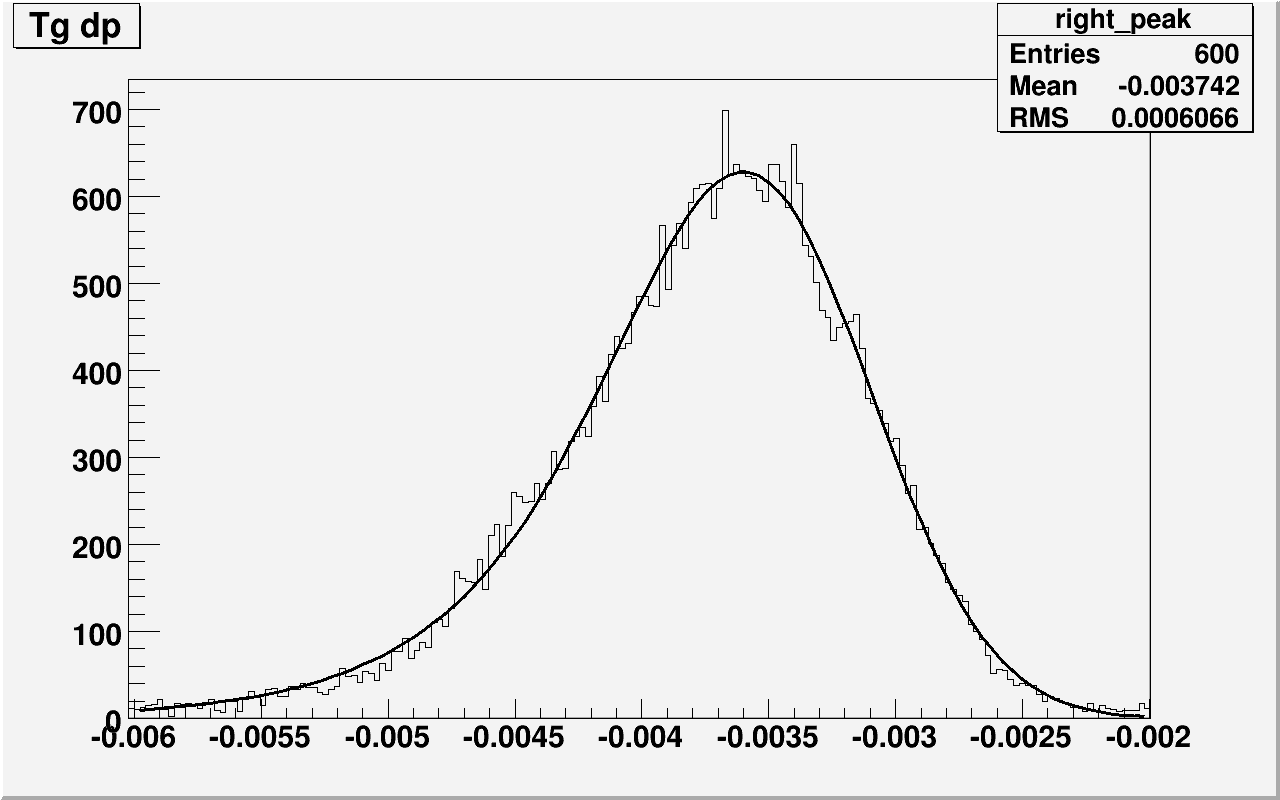
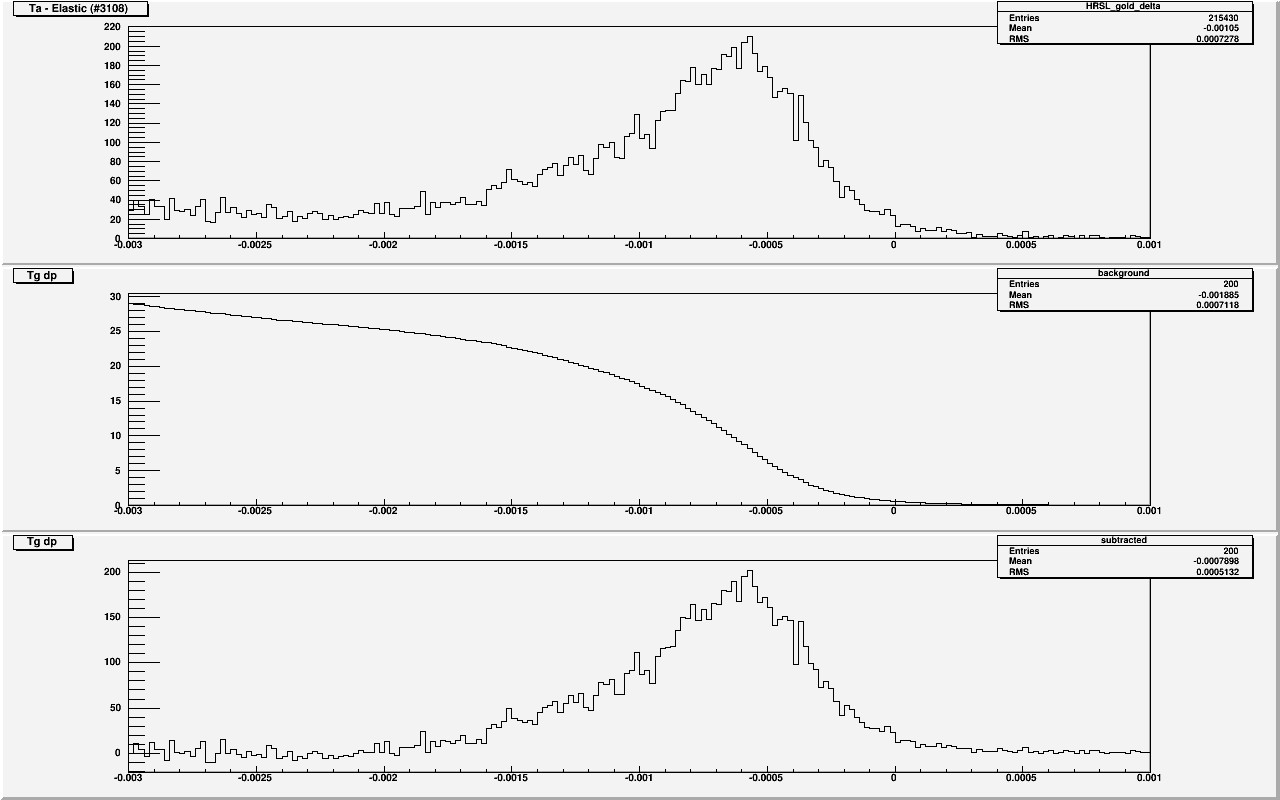
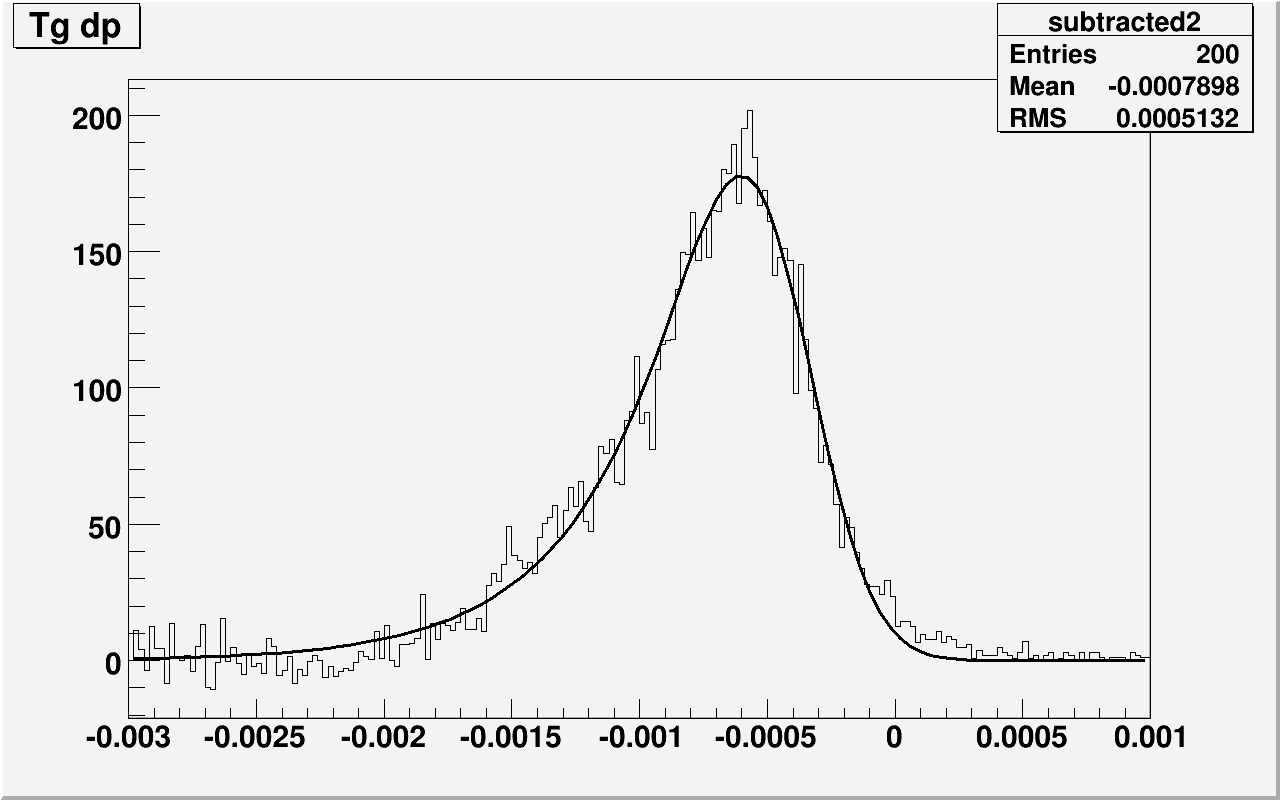
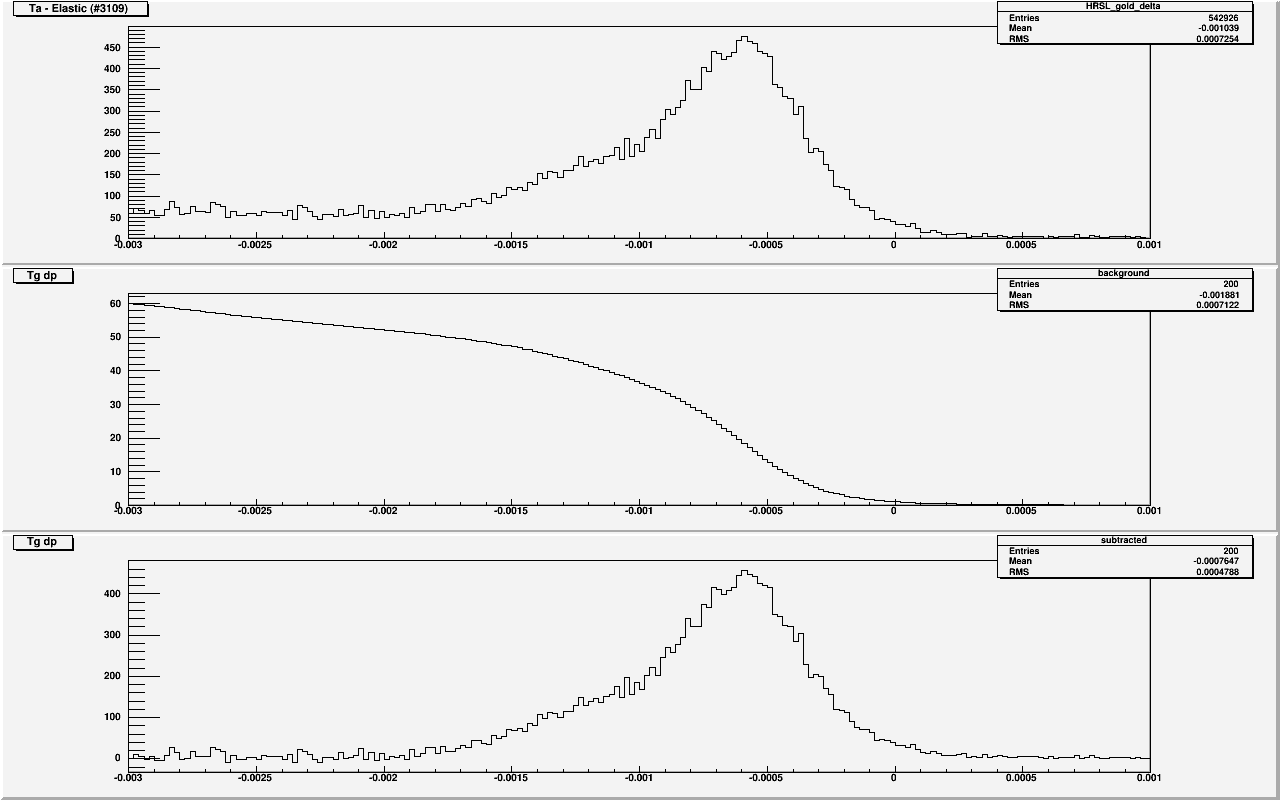
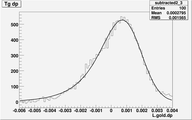
Ta - runs :
Run #3108:
-----------------


A = 290.554
b = -0.000394169
sigma = 0.000211373
alpha = 0.000399357
max_x = -0.000603537
max_y = 177.901
dA = 1.15312
db = 7.61643e-07
dsigma = 8.06693e-07
dalpha = 1.67312e-06
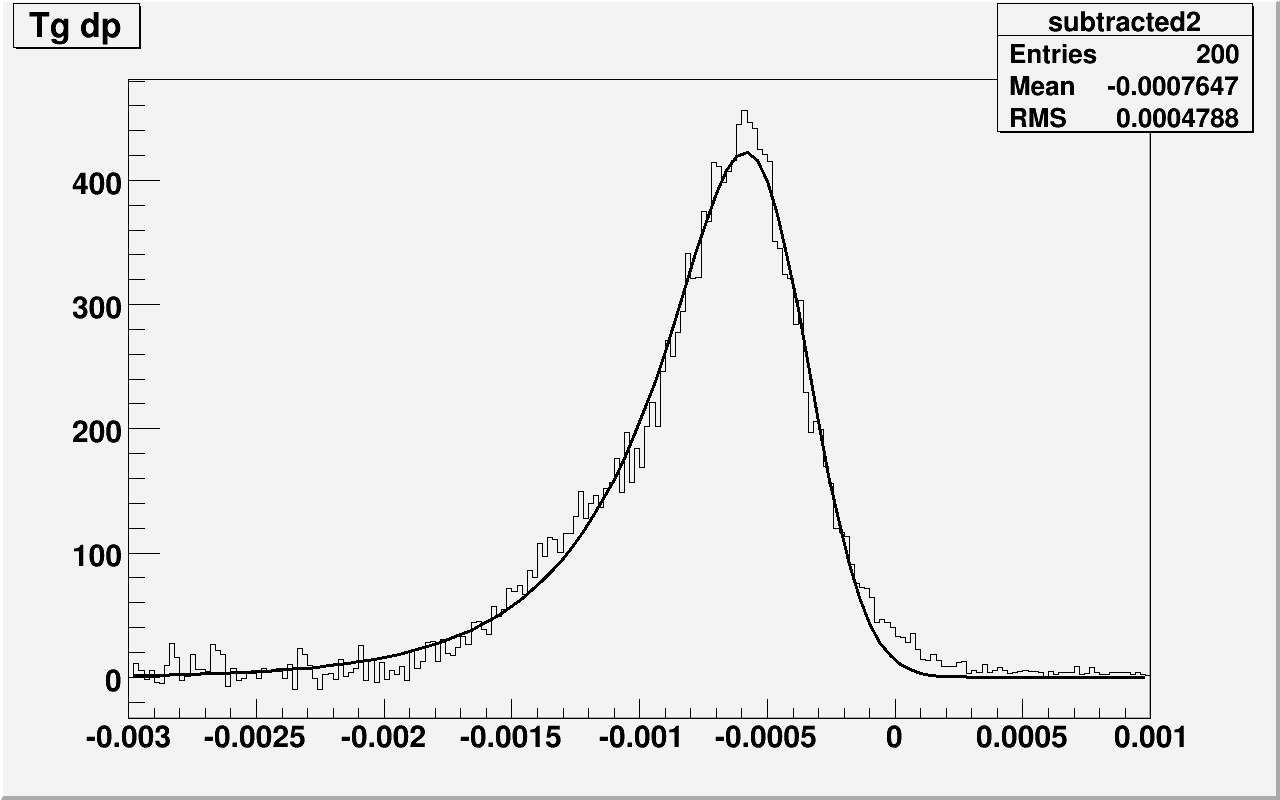
Run #3109:
-----------------
A = 723.475
b = -0.000391605
sigma = 0.000187612
alpha = 0.000390507
max_x = -0.000586196
max_y = 422.495
dA = 1.25011
db = 2.89983e-07
dsigma = 3.11132e-07
dalpha = 6.71826e-07
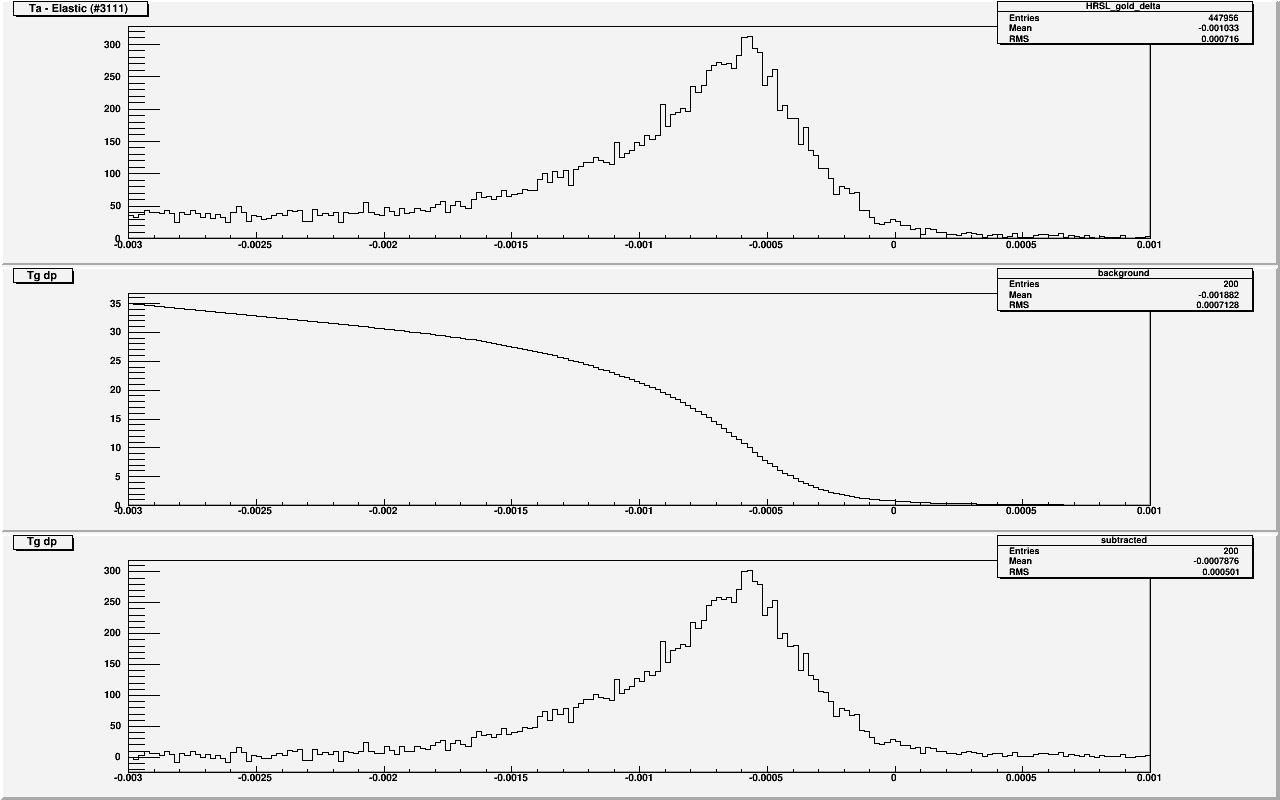
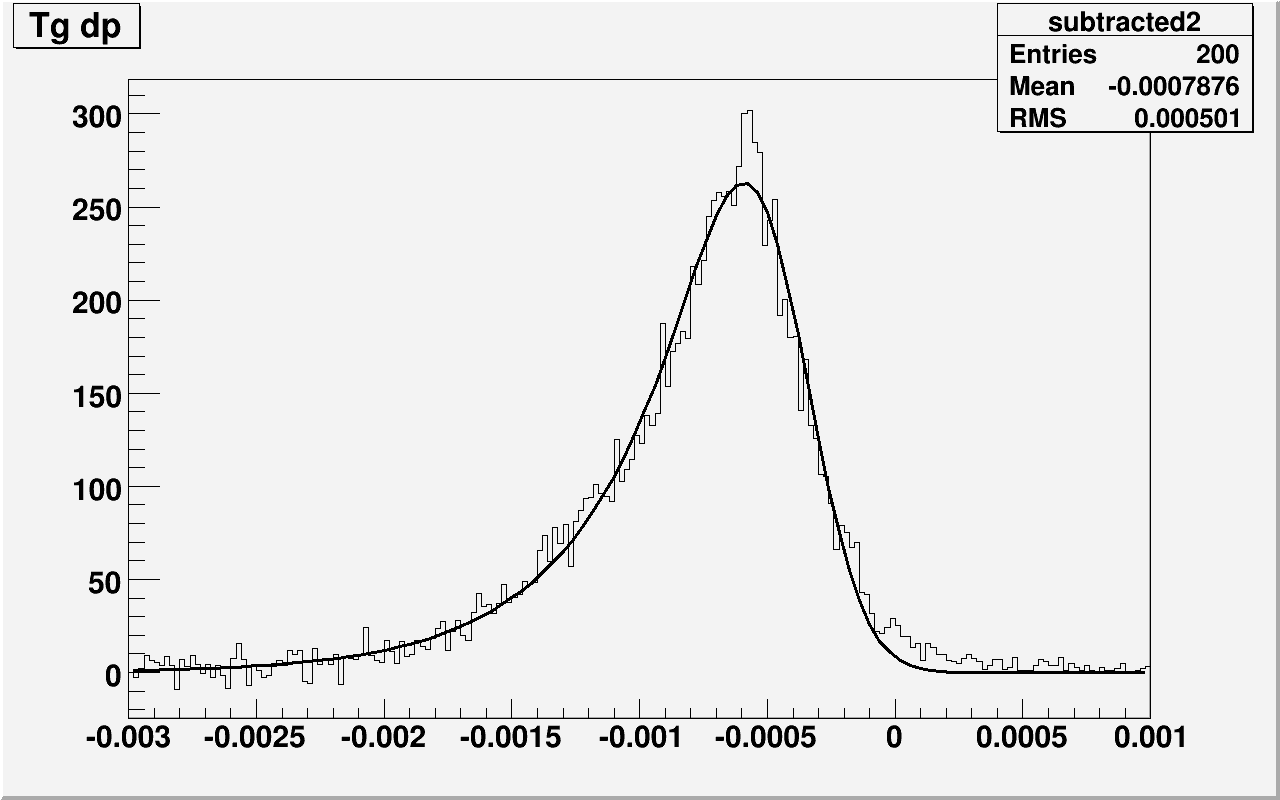
Run #3111:
-----------------

A = 463.876
b = -0.000392823
sigma = 0.000187388
alpha = 0.000412888
max_x = -0.000592355
max_y = 263.154
dA = 1.29169
db = 4.57065e-07
dsigma = 5.01922e-07
dalpha = 1.09323e-06
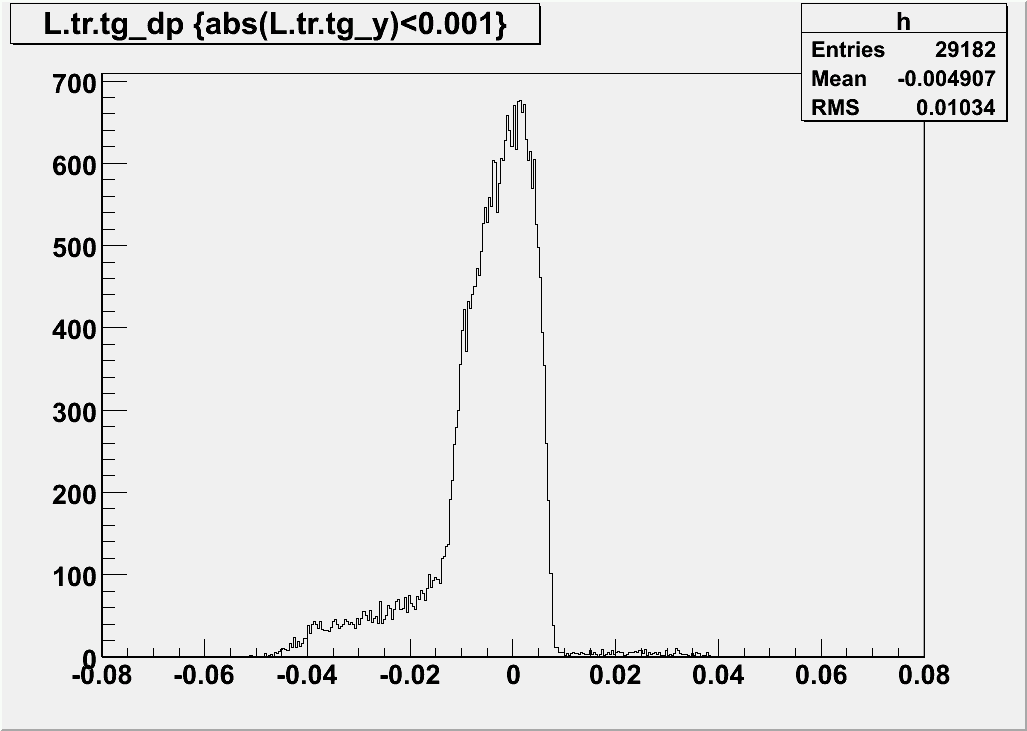
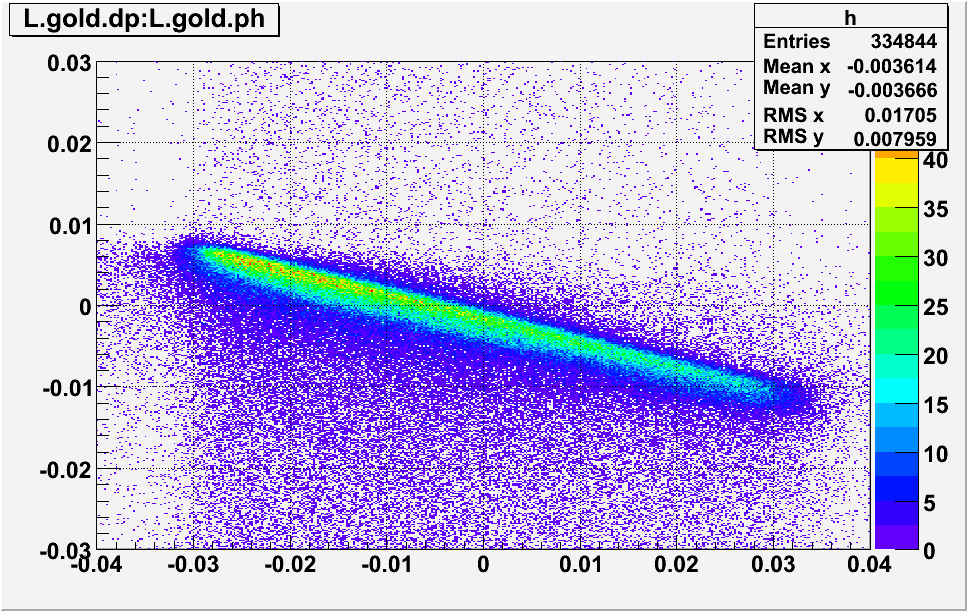
H - runs :
Both Ta and C tarted are thin targets and therefore cause no serious problems when fitting
the data. However, Hydrogen target is extended target and requires some more work to correctly fit the
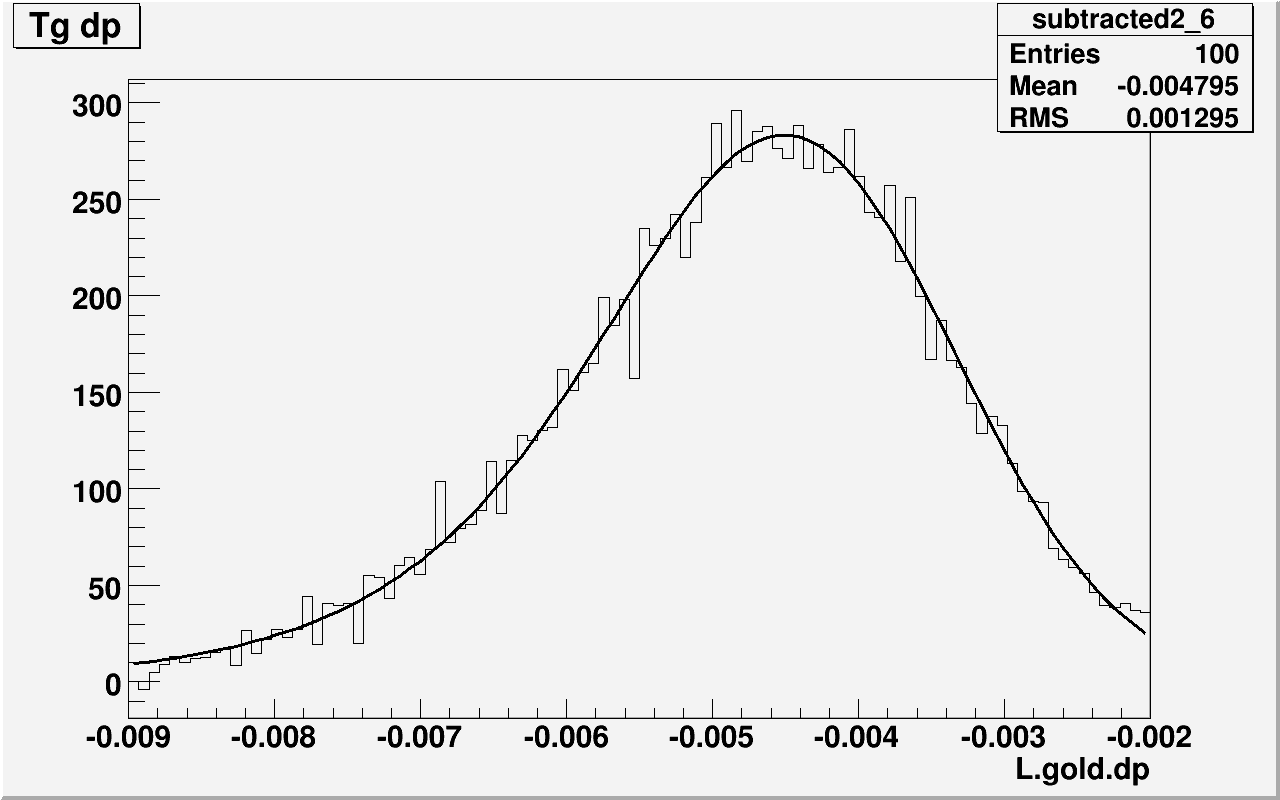
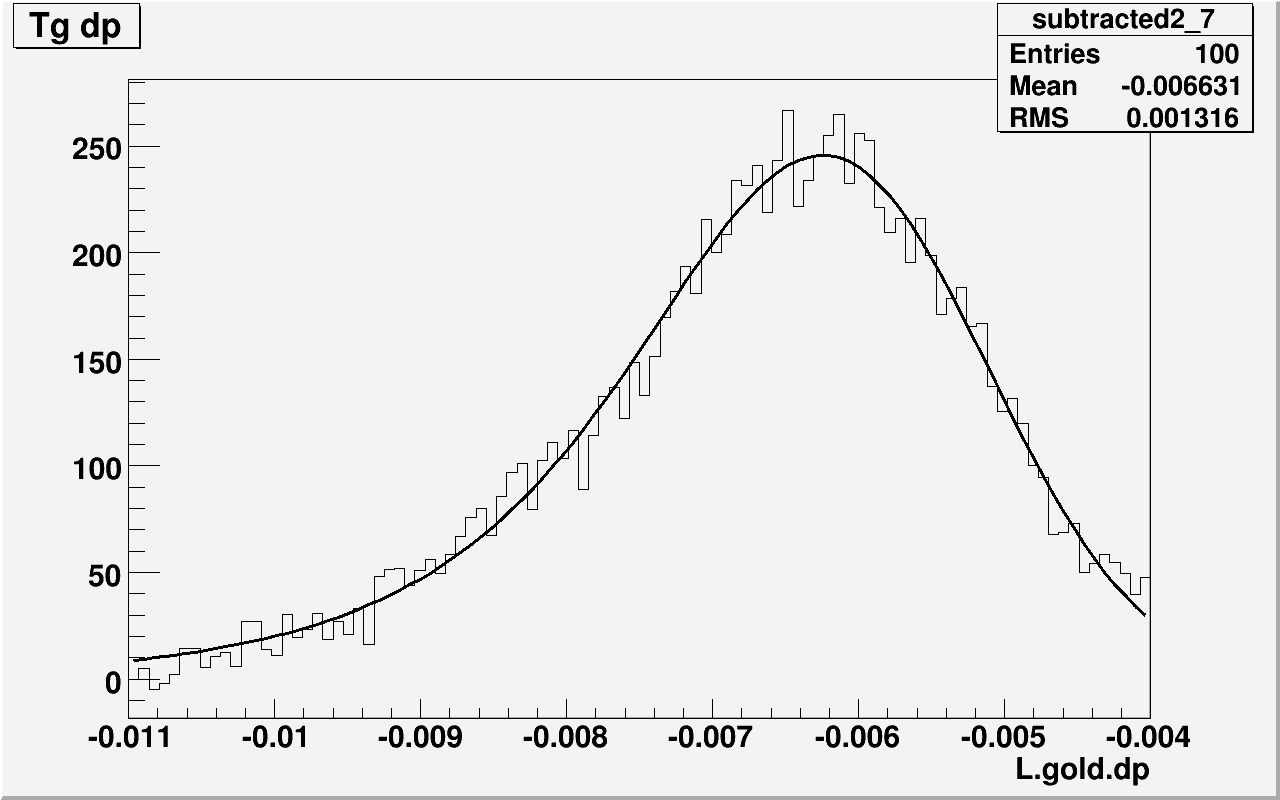
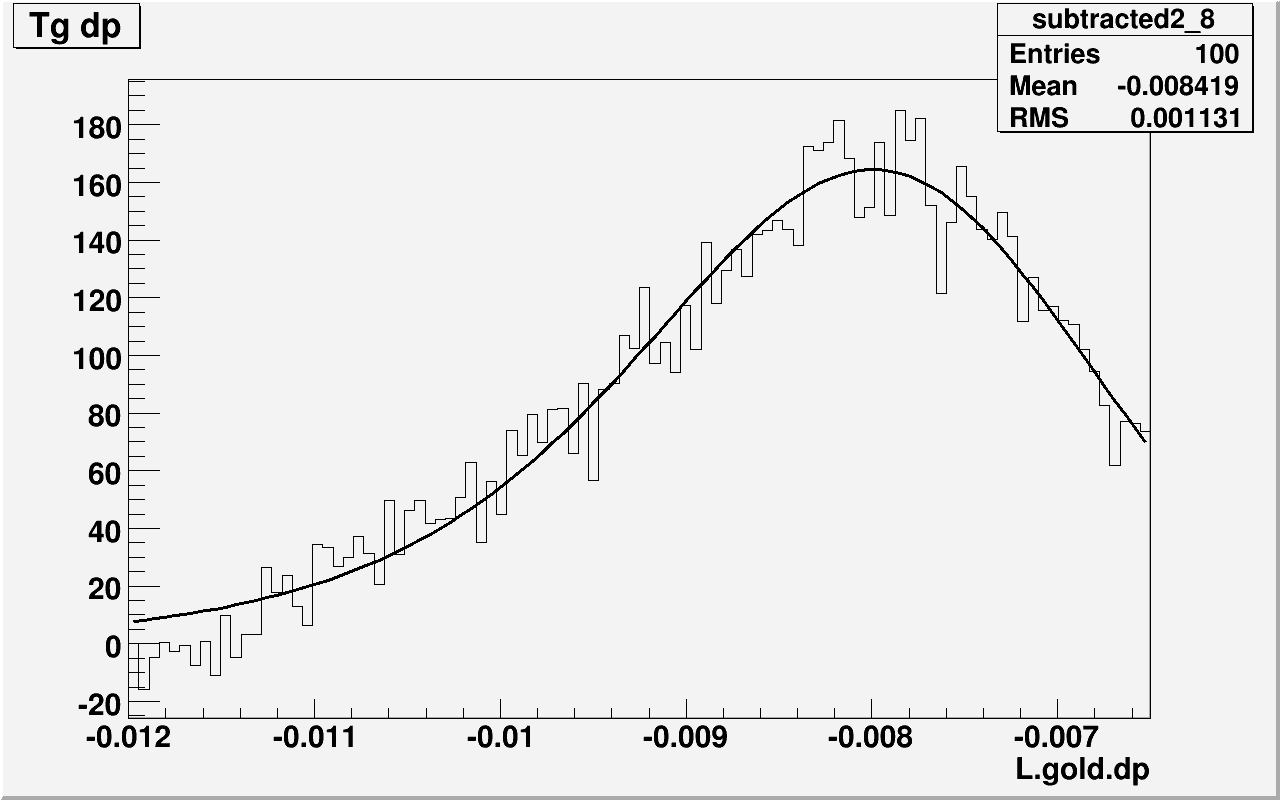
data. We can not fit directly the "L.gold.dp" histograms without some modifications:
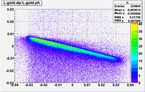
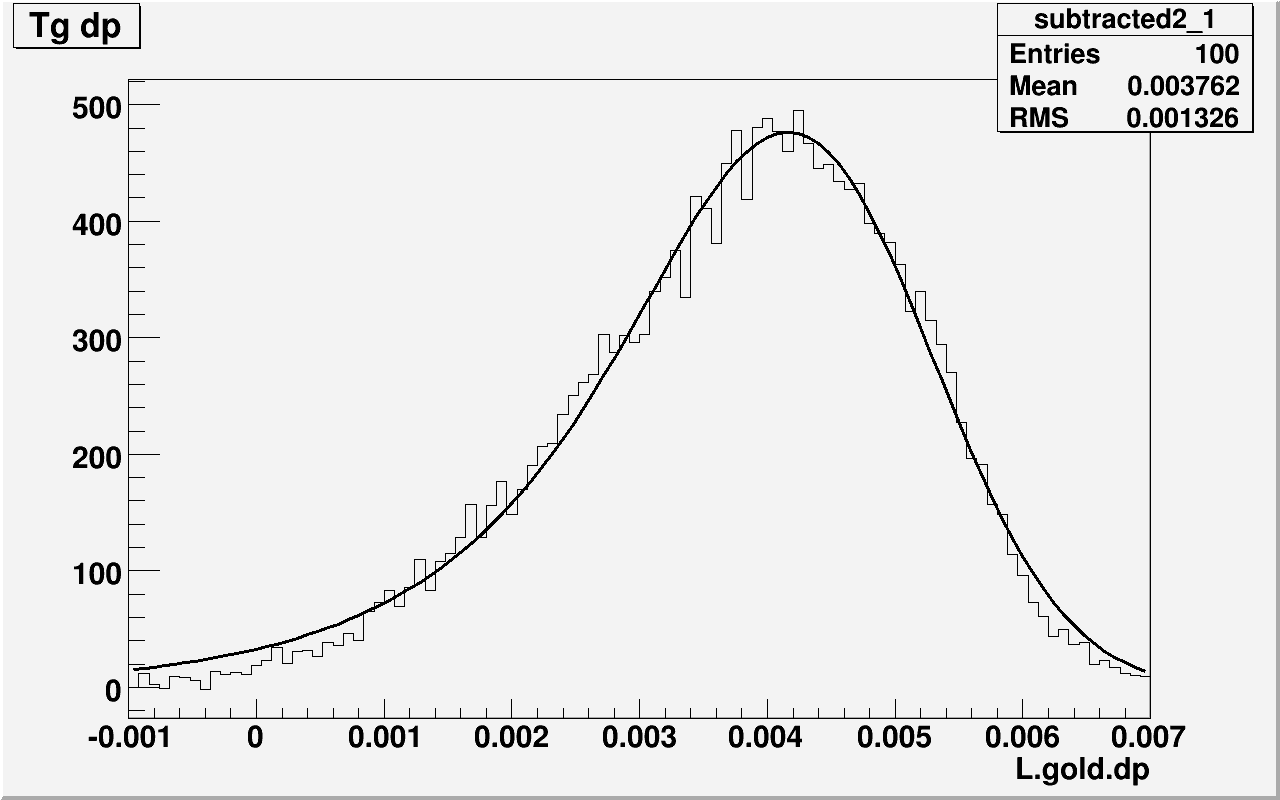
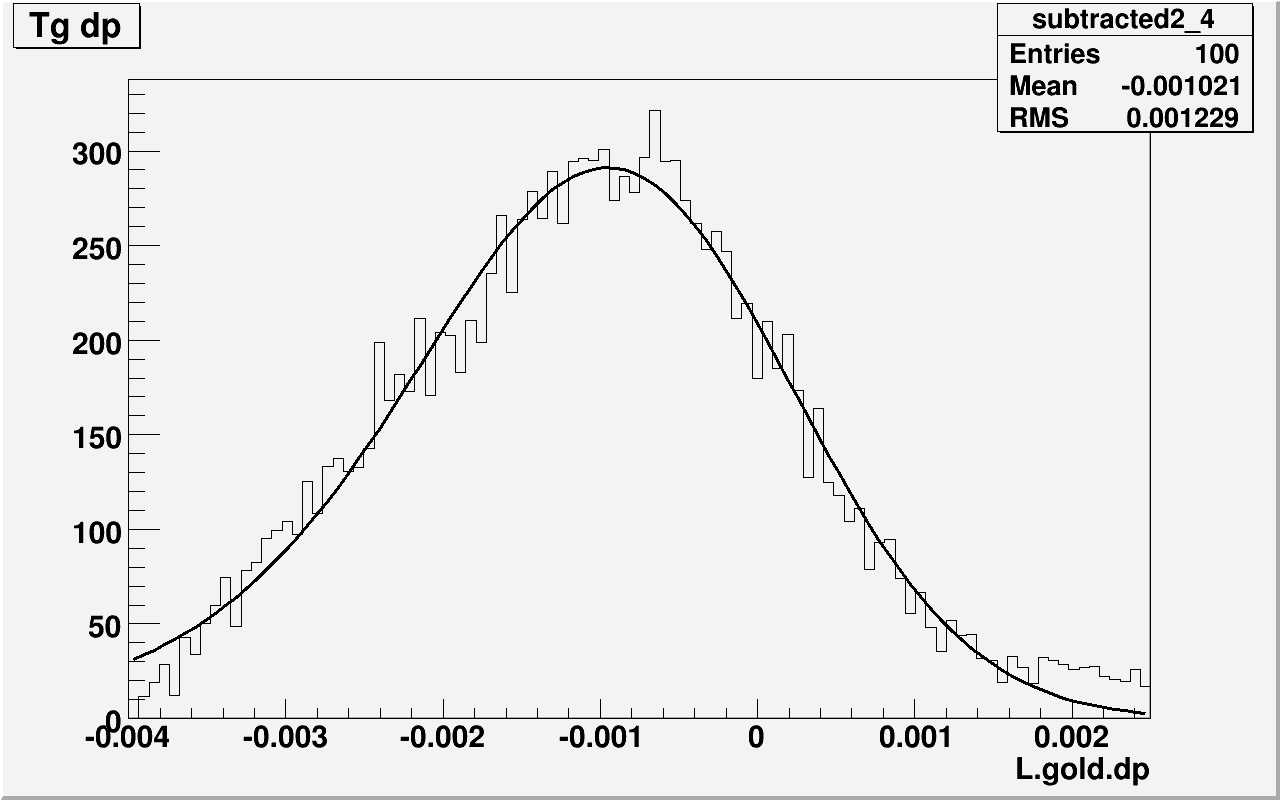
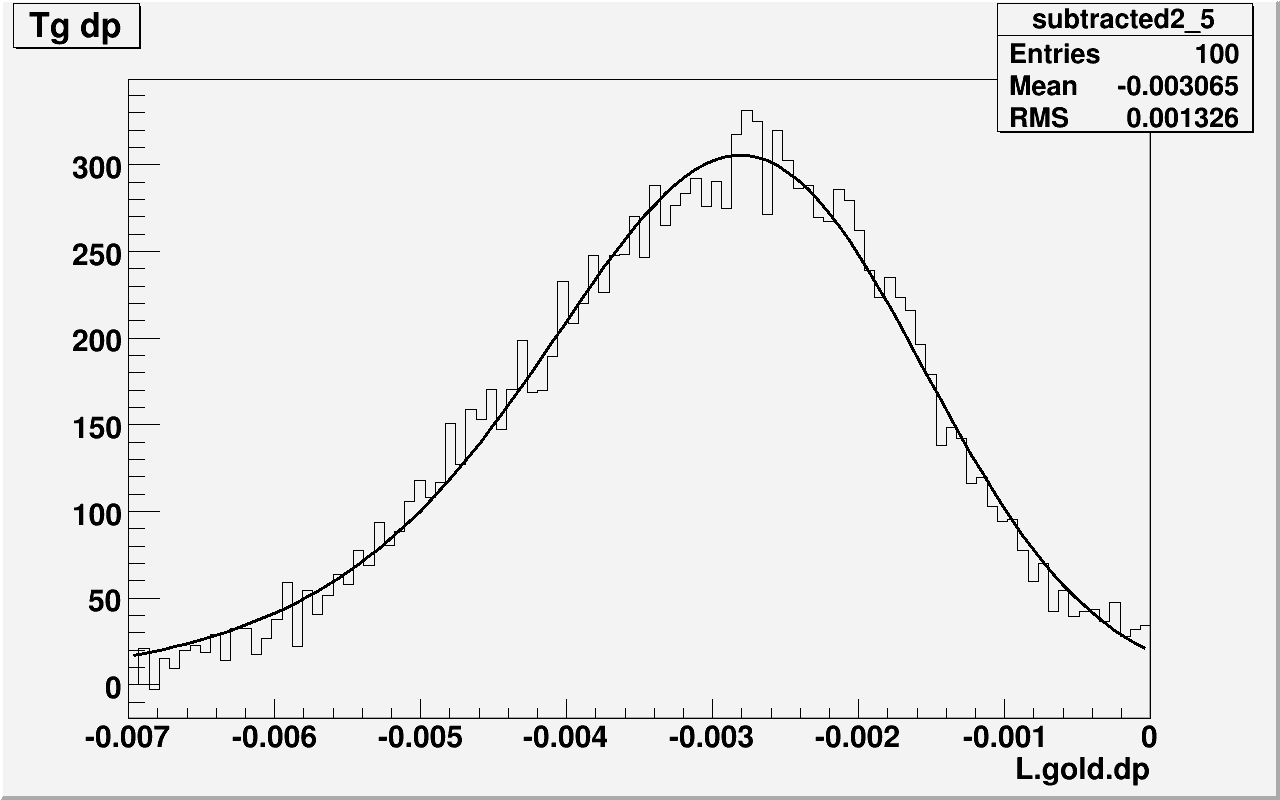
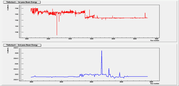
We have decided to do the following thing. We have devided "L.gold.ph" into ten different angle regions. Then we plotted "L.gold.dp" for each of these regions and fit the histogram:


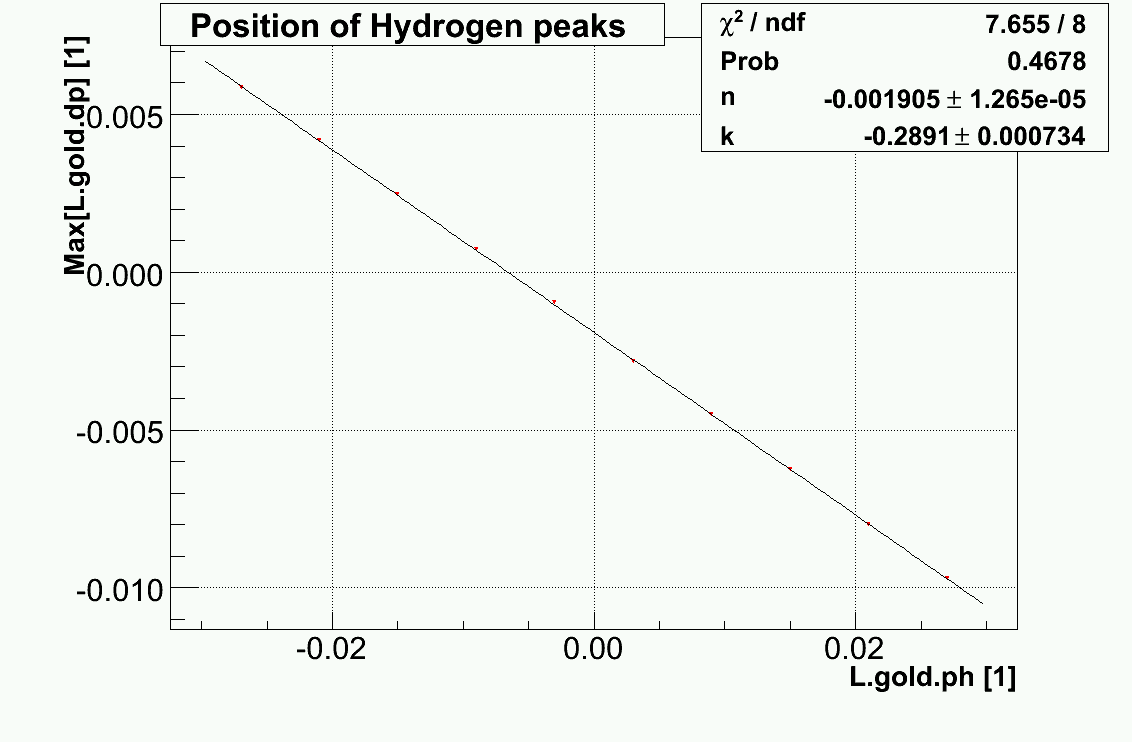
Afterwards we determined the maximum for each fit (at different angle) and plot them as
a function of the angle "L.gold.ph". We have got the following results:
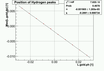
Fit Parameters:
  NO.   NAME      VALUE            ERROR
------------------------------------------------
   1  n           -1.90498e-03   1.26488e-05
   2  k           -2.89120e-01   7.33974e-04
That means that position of the maximum of "L.gold.dp" at "L.gold.ph=0" is -1.904E-3.
Energy losses:
Before we can fit the data and determine the beam energy, we need to estimate the energy losses for all
three targets. We have considered losses in following materials for all three targets:
Carbon target:
   Material          |       Thickness [cm]
---------------------------------------------
 Carbon target       |        0.0419
 Titan window        |        0.00762
    Air              |        65.1
 Kapton window       |        0.03556
Tantalum target:
   Material          |       Thickness [cm]
---------------------------------------------
 Tantalum target     |        0.001213
 Titan window        |        0.00762
    Air              |        65.1
 Kapton window       |        0.03556
Hydrogen target:
   Material          |       Thickness [cm]
---------------------------------------------
 Aluminium           |        0.0127
 Hydrogen target     |        6.0
 Aluminium           |        0.0127
 Titan window        |        0.00762
    Air              |        65.1
 Kapton window       |        0.03556
In the end we got following estimations for the energy losses:
  Target       | Energy Loss [MeV]
------------------------------------
   Hydrogen    |     1.64
   Carbon      |     0.34
   Tantalum    |     0.25
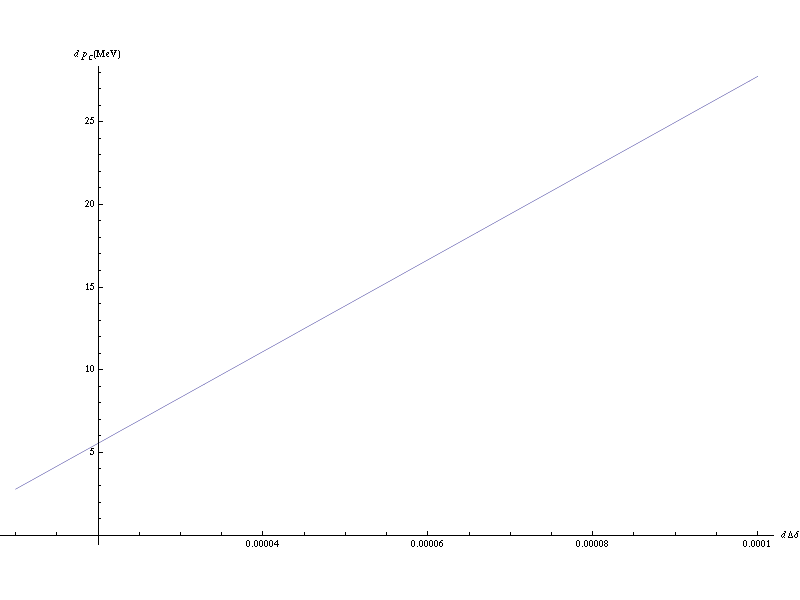
Central momentum determination:
We were also trying to determine the central momentum of the spectrometer in order
to check the EPICS values from HALOG entries. To do that we intended to use 1st and
3rd excited state of carbon. The difference between the elastic peak and these two states
are very well know and if we can measure delta well enought we can directly calculate the
cantral momentum of the spectrometer from the following formula:
p_central = 4.4389MeV/(delta_elastic - delta_1st).
However, there is a problem. The error for this formula (momentum) goes as:
dp_central = 4.4389MeV/(delta_elastic - delta_1st)^2 * d(delta_elastic - delta_1st).
From this formula we can see that we can not measure "delta" accuratly well enough, so that
error in p_central would be small enough (<0.5MeV).
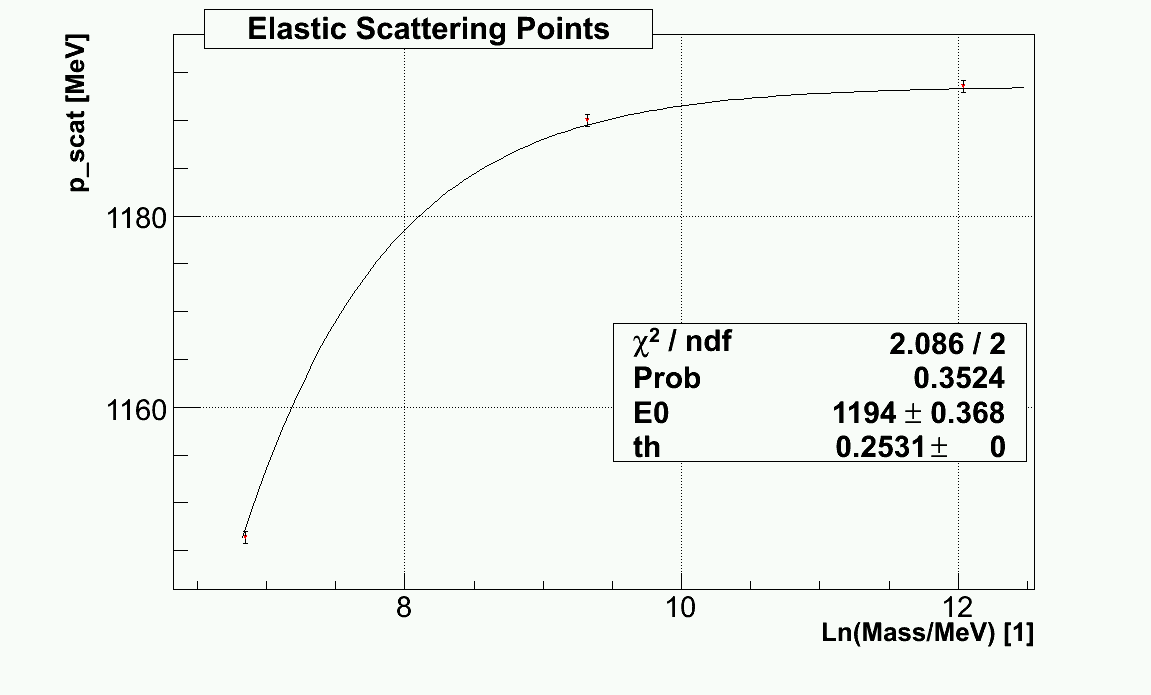
Final Fit:
Now that we have all the poins (deltas) for all three targets we can try to fit the beam energy. In this
procedure we assumed that central momentum of the Left-arm spectrometer is well known and can be used as a
fixed parameter in our fit. This is necessary because all three points were not meassured at the same setting of the spectrometer. In the end we get:
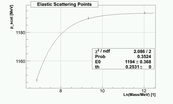
Beam energy: (1.19360e+03 +- 3.67975e-01) MeV
We can now compare this value to the corresponding Tiefenbach value from this region:
Tiefenbach energy: approx. 1.1932e+03 MeV
More detailed analysis of the Tiefenbach energies:
If we compare beam energy determined from the elastic runs with the Tiefenbach values, we can see that
they agree within the error. That means that if we can trust this analysis we can use the Tiefenbach values
to determine the beam energy with accuary around 3.4E-4.
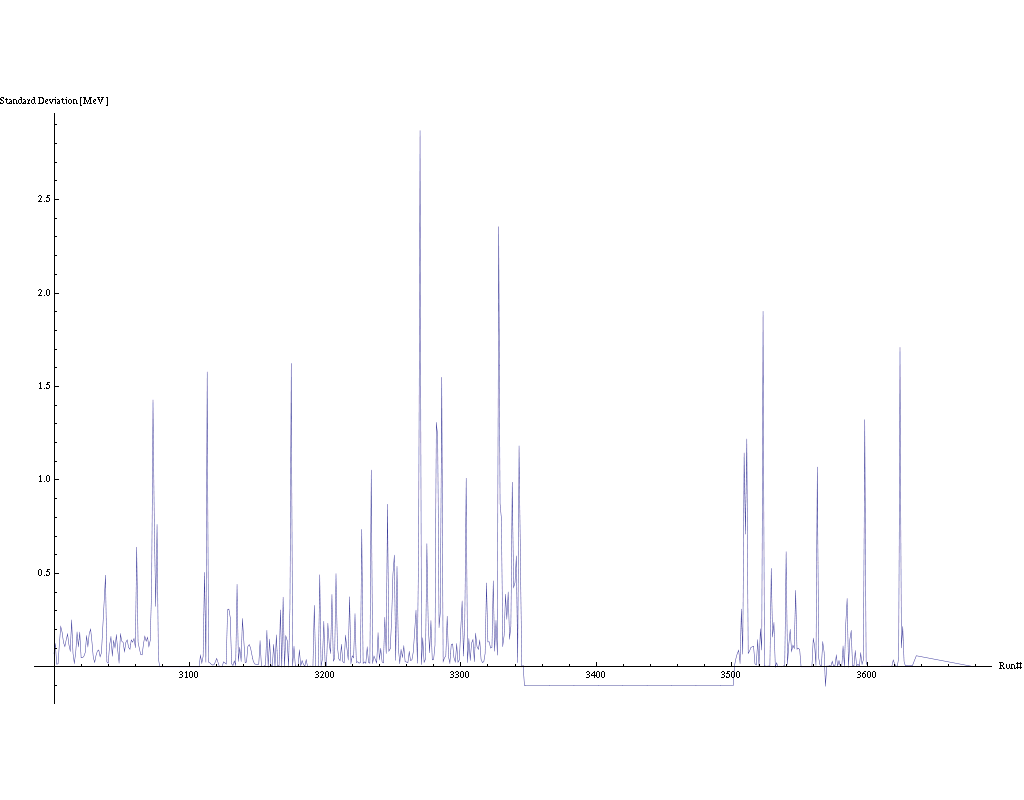
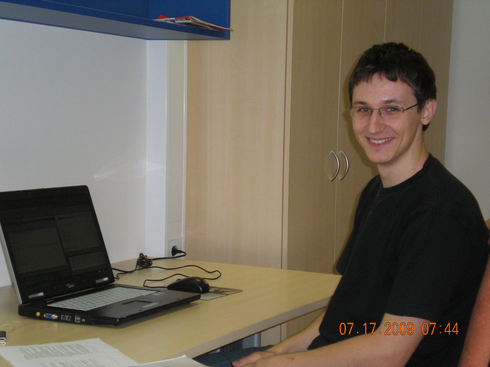
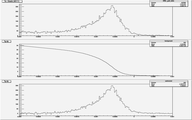
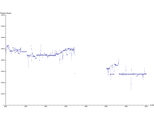
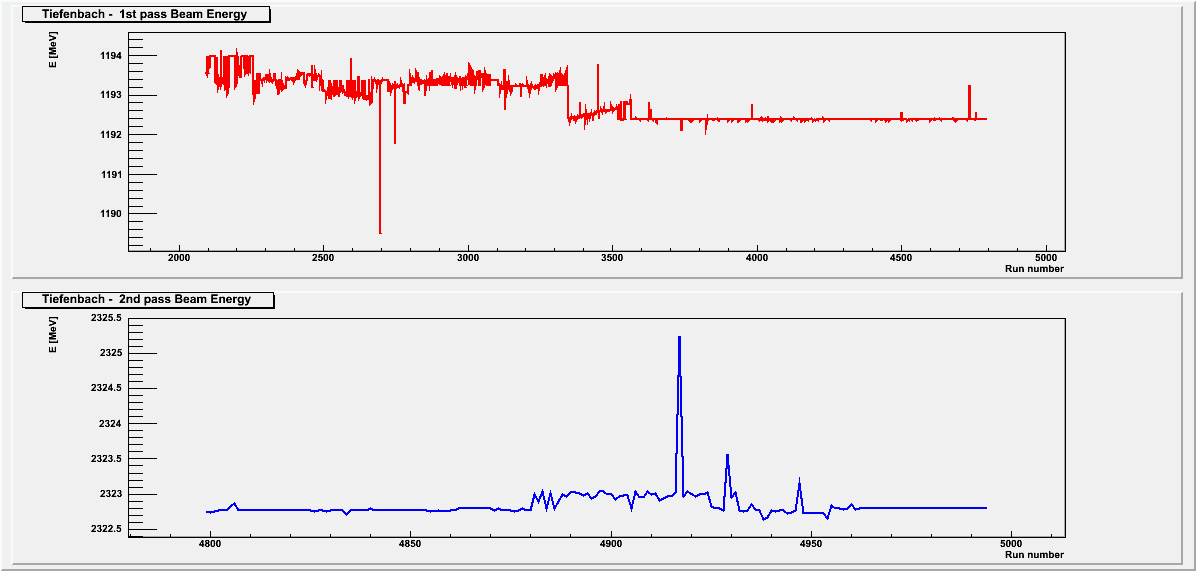
We also want to know, how beam energy changes during the each run, because this can significantly
affect further analysis. To do that we made shell script that reads Tiefenbach values from every run
and calculates the mean Tiegenbach energy (with its error) and standard deviation for the given run,
which can be used as a meassure for how much energy changes during the run. We are running this script
on Farm. So far we were able to analyze runs #3000 - #3700. Here are the results:
Problem:
Runs between #3347 and #3501 seem to contain no EPICS information. We need to check this
in more detail!!!

 ,
12C:
,
12C: 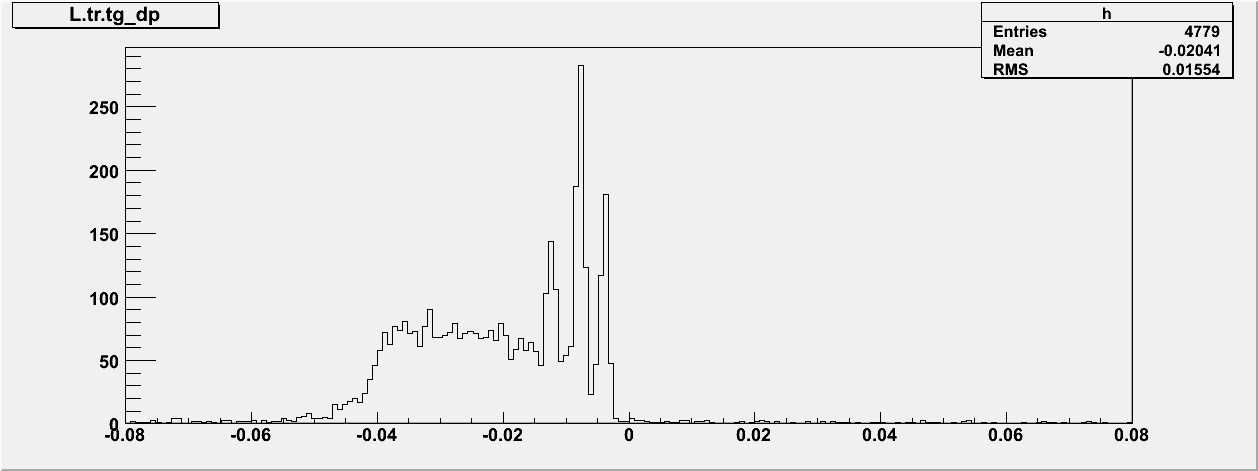 ,
H:
,
H: