Privacy and Security Notice
Meeting No3 - Threshold Pi0 beam energy determination
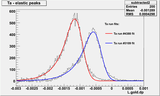
Elastic scattering analysis
Ta-only analysis:
We have analyzed few Tantalum runs and tried to determine beam energy using only these
runs (without H and C data). Than we compared these values with the corresponding Tiefenbach
data. Here are the results that we got:
RUN # |  Angle  |  Tiefenbach  |    Error   |   STDEV    |  Measured energy  |  Difference | Rel.Difference
============================================================================================================
2356  |   20.5  |  1193.17 MeV | 0.0061MeV  | 0.0961 MeV |    1193.63 MeV    |    0.46 MeV |  4.0E-4
3109  |   14.5  |  1193.19 MeV | 0.0025 MeV | 0.0187 MeV |    1193.82 MeV    |    0.63 MeV |  5.2E-4
4388  |   14.5  |  1192.38 MeV | 0.0006 MeV | 0.0038 MeV |    1193.11 MeV    |    0.73 MeV |  6.1E-4
4517  |   14.5  |  1192.38 MeV | 0.0008 MeV | 0.0052 MeV |    1192.94 MeV    |    0.56 MeV |  5.0E-4
4644  |   16.5  |  1192.38 MeV | 0.0003 MeV | 0.0025 MeV |    1192.84 MeV    |    0.46 MeV |  4.0E-4
4671  |   14.5  |  1192.38 MeV | 0.0006 MeV | 0.0035 MeV |    1193.06 MeV    |    0.68 MeV |  6.0E-4
4672  |   14.5  |  1192.38 MeV | 0.0005 MeV | 0.0034 MeV |    1193.07 MeV    |    0.69 MeV |  6.0E-4
4755  |   20.5  |  1192.37 MeV | 0.0005 MeV | 0.0082 MeV |    1192.84 MeV    |    0.79 MeV |  6.6E-4
Notice: :
When calculating the beam energy from the delta-spectra we considered tantalum recoil correction
and Energy losses. In this analysis we also considered only those Tiefenbach values where beam current and HALLA_dpp variables were not zero.
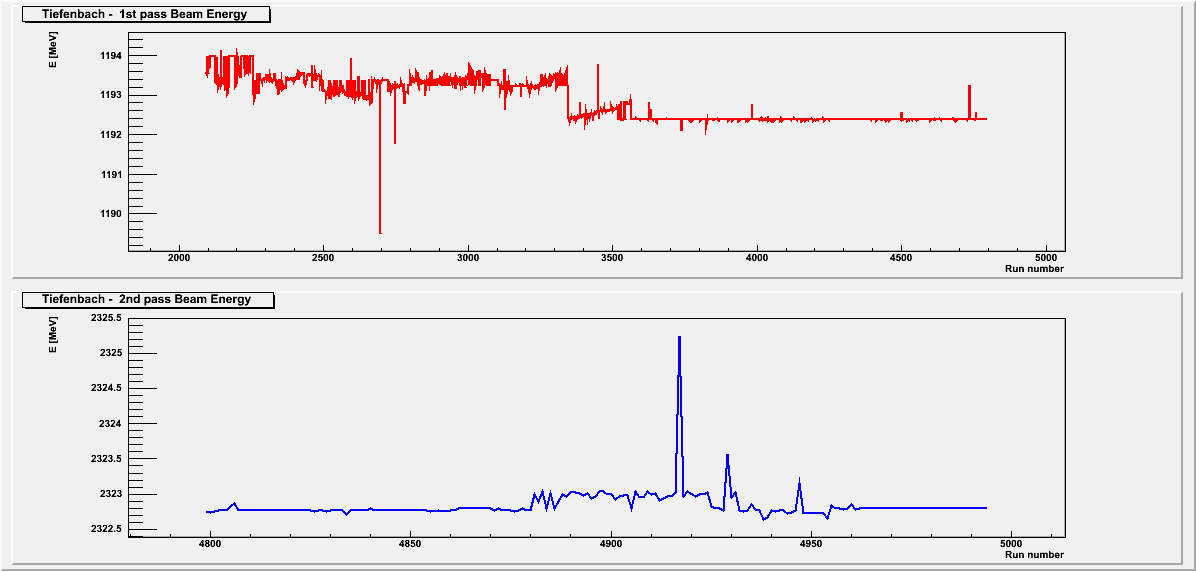
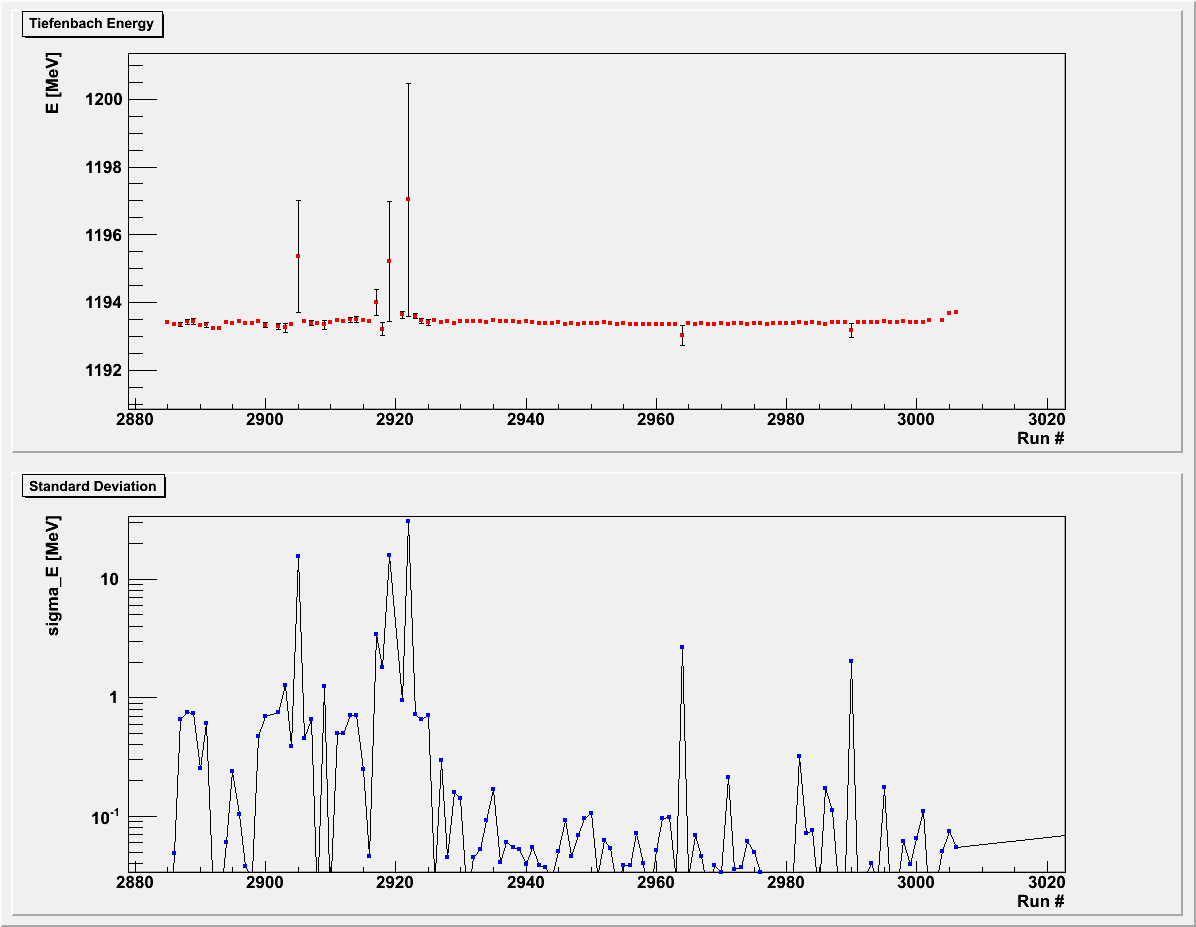
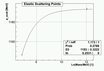
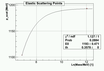
When we look at the Tiefenbach data (please see first figure below) we can see an approx. 0.5 MeV jump in energy after Beam Energy lock was turned on. To check if this jump is real I compared two tantalum runs from the same kinematics but from two different run periods. Here are the results:
.
  Run # |  Tiefenbach  |  delta       |   momentum
===================================================
  4388  |    1192.38   |  -0.00116458 |  1192.5995
  3109  |    1193.20   |  -0.0005862  |  1193.2901
---------------------------------------------------
  Diff. |    0.82      |   0.00057838 |    0.6906
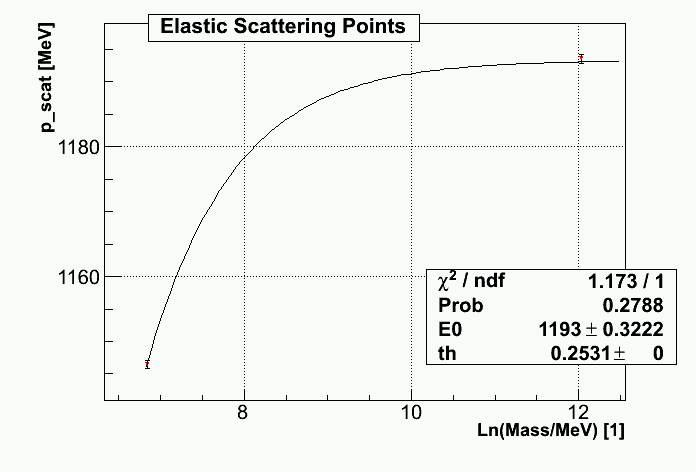
1st Run series (Results from last week):
Fit parameters and results:
  EXT PARAMETER                  PARABOLIC         MINOS ERRORS
  NO.   NAME      VALUE            ERROR      NEGATIVE      POSITIVE
   1  E0           1.19334e+03   3.22192e-01
   2  th           2.53073e-01     fixed
Corresponding Tiefenbach Values:
Target  |  Run number      |  Tiefenbach  | STDEV |
===============================================================
 Ta     |     3109         |    1193.19   |  0.02
 Ta     |     3111         |    1193.11   |  0.6  (No used so far)
 Ta     |     3108         |    1193.20   |  0.03
----------------------------------------------------------------
  H     |     3136         |    1193.16   |  0.04
  H     |     3135         |    1193.17   |  0.03
----------------------------------------------------------------
  12C   | 3112, 3113, 3130 |    1193.16   |  0.06 (analyzed together)
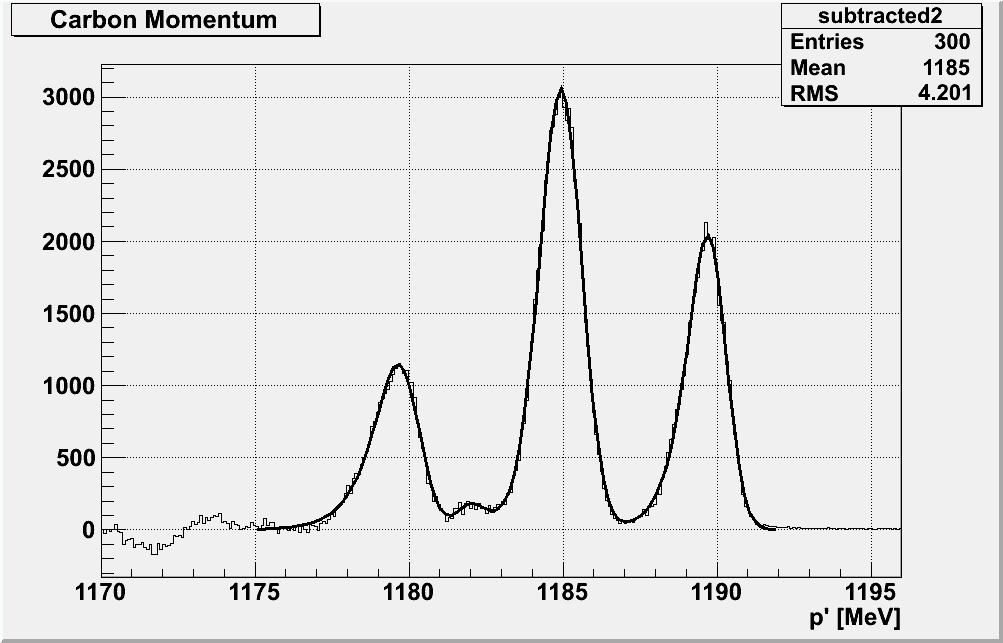
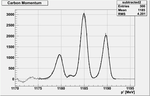
Carbon Test:
Last week I mentioned that we can not use excited carbon states to determine the central momentum of the spectrometer. However, we can check how good our "assumed" value for the central momentum is. Therefore I have taken the central momentum (given by the NMR), fitted all four peaks and calculate the energy difference between them. Here are the results:
Fit parameters and results:
 EXT PARAMETER                APPROXIMATE        STEP         FIRST
  NO.   NAME      VALUE            ERROR          SIZE      DERIVATIVE
   1  p0           2.67096e+03   1.25503e+00   1.25503e-02   2.00279e+05
   2  p1           1.19007e+03   2.99070e-04   2.99070e-06   9.95415e+05
   3  p2           5.15206e-01   2.26692e-04   2.26692e-06  -9.25962e+05
   4  p3           5.62145e-01   5.00586e-04   5.00586e-06   1.57945e+06
   5  p4           3.49161e+03   1.32137e+00   1.32137e-02   3.90477e+08
   6  p5           1.18525e+03   4.17433e-04   4.17433e-06   4.62219e+06
   7  p6           6.10932e-01   2.07759e-04   2.07759e-06   7.52749e+08
   8  p7           3.89825e-01   5.75443e-04   5.75443e-06  -5.43927e+08
   9  p8           1.59803e+03   1.42992e+00   1.42992e-02   2.11221e+05
  10  p9           1.18011e+03   5.30217e-04   5.30217e-06   4.87751e+05
  11  p10          5.68028e-01   4.88145e-04   4.88145e-06  -1.92477e+06
  12  p11          7.40795e-01   9.75732e-04   9.75732e-06   1.01676e+05
  13  p12          1.70734e+02   3.71917e-01   3.71917e-03  -2.05164e+04
  14  p13          1.18207e+03   1.46801e-03   1.46801e-05   1.14989e+05
  15  p14          4.83302e-01   1.29594e-03   1.29594e-05   2.86833e+05
  16  p15          5.00000e-02   1.07502e-03   1.07502e-05** at limit **
Peak1 has maximum value 2037.82, at: 1189.69
Peak2 has maximum value 3059.16, at: 1184.94
Peak3 has maximum value 183.17, at: 1182.06
Peak4 has maximum value 1145.47, at: 1179.65
Maximum value: 3059.16 is at: 1184.94
First excited state: 4.75673
Second excited state: 7.63033
Third excited state: 10.0464
Comparison of the carbon results with true values:
 Carbon excited state |  Measured value  |  True value | Difference
======================================================================
        1st.          |    4.75673 MeV   |  4.4389 MeV |  0.31783 MeV
        2nd.          |    7.63033 MeV   |  7.6542 MeV |  0.02389 MeV
        3rd.          |    10.0464 MeV   |  9.6410 MeV |  0.4054  MeV
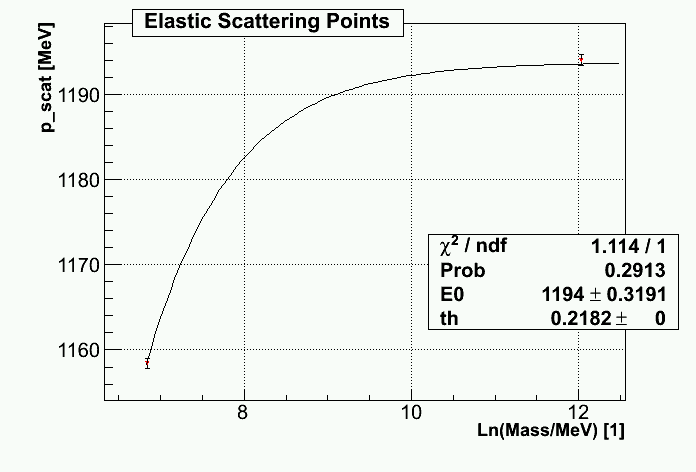
2nd Run series
Fit parameters and results:
  EXT PARAMETER                  PARABOLIC         MINOS ERRORS
  NO.   NAME      VALUE            ERROR      NEGATIVE      POSITIVE
   1  E0           1.19381e+03   3.19135e-01
   2  th           2.18166e-01     fixed
Corresponding Tiefenbach Values:
Target  |  Run number      |  Tiefenbach  | STDEV |
===============================================================
 Ta     |     2874         |    1193.6    |  0.13
 Ta     |     2875         |    1193.58   |  0.0186
 Ta     |     2876         |    1193.60   |  0.0285
 Ta     |     2877         |    1193.58   |  0.109
----------------------------------------------------------------
  H     |     2885         |    1193.41   |  0.0037
----------------------------------------------------------------
  12C   |     2884         |    1193.38   |  0.17
From the Tiefenbach values above we can see, that there is a 0.2MeV difference between
Ta and H Tiefenbach values. I have assumed that this difference is real and corrected measured Hydrogen
measurement for this value, before fitting the data.
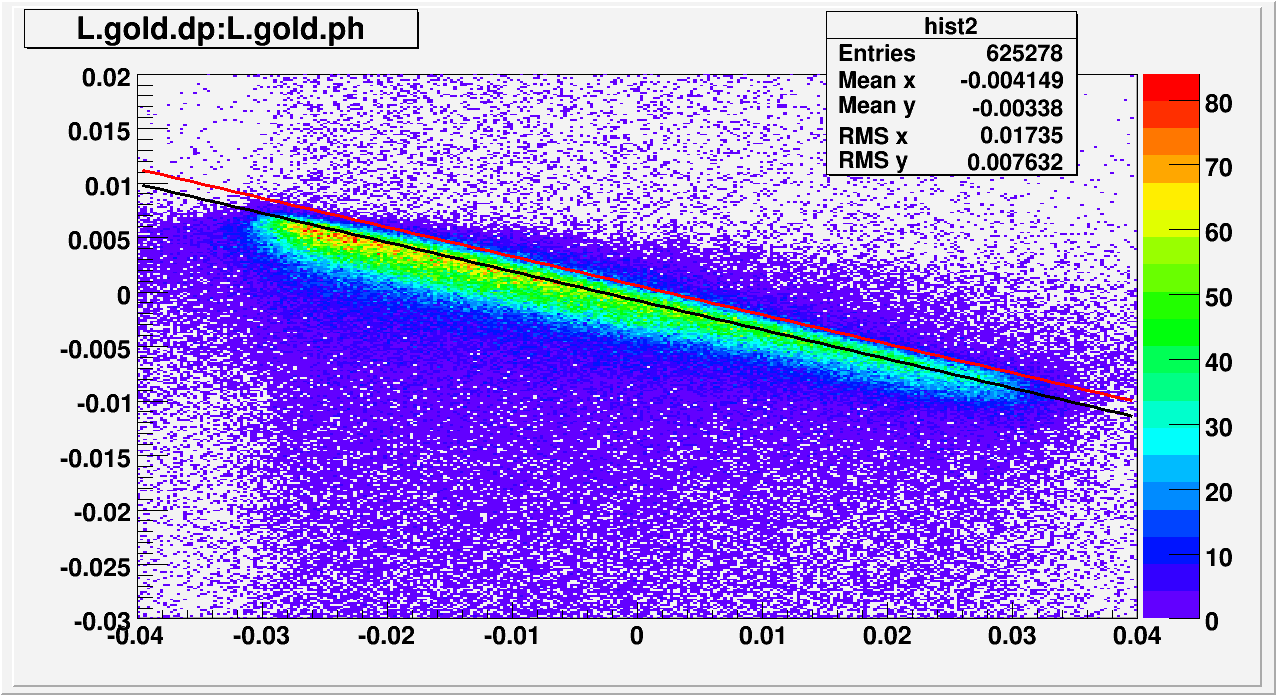
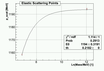
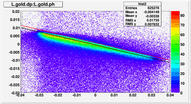
Energy loss check:
Next plot shows linear fit of the Hydrogen data using the fitted beam energy. The red line corresponds to the fit, where we do NOT consider energy losses. The black line
corresponds to the fit where we took energy losses into consideration.
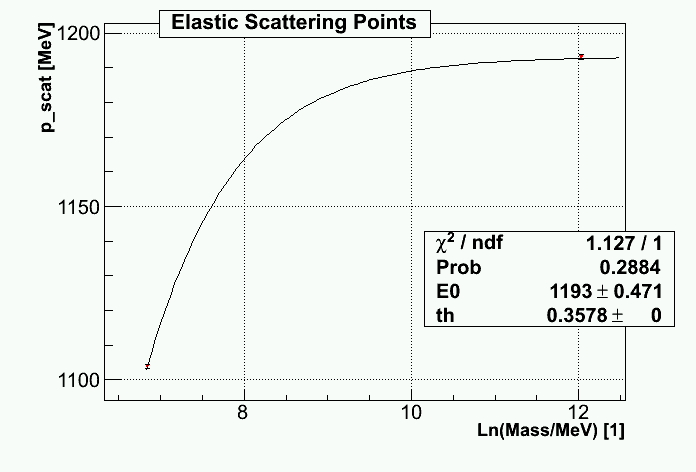
3rd Run series
Fit parameters and results:
  EXT PARAMETER                  PARABOLIC         MINOS ERRORS
  NO.   NAME      VALUE            ERROR      NEGATIVE      POSITIVE
   1  E0           1.19320e+03   4.70976e-01
   2  th           3.57792e-01     fixed
Corresponding Tiefenbach Values:
Target  |  Run number      |  Tiefenbach  | STDEV |
===============================================================
 Ta     |     2356         |    1193.17   |  0.096
----------------------------------------------------------------
  H     |     2360         |    1193.16   |  0.047
----------------------------------------------------------------
Tiefenbach Analysis:
Here are some results of the analysis of the Tiefenbach values made on Farm. This time we considered
only those values when beam current and HALLA_dpp values were not zero. To do that we couldn't use "grep"
any more but had to use analyzer. Therefore we have written analyzer script that first analyzes raw data files and makes root files. After that we used another root script which reads all epics variables
from the root file and caclulates the mean Tiefenbach energy and it's erros. This analysis is much slower now. So far
we were able to analyze 100 runs and here are the results:

Notice:
To set up my analysis on the Farm I have used Bryan's manual and scripts. They were of great help. However, I fould a litte bug in his perl script "submit.pl", which causes Jasmin to load to many runs. The problem is in
variable that stores a list of all runs to analyze in given job. However this variable is not
cleaned when we submit another job. Therefore the number of submitted runs rises exponentially (I have tried that :) ).
To-Do:
1.) Finish the same analysis for the rest of the available elastic runs. At the moment we are in the middle of the analysis of the runs with run numbers > 4000.
2.) Do the same consistancy checks (Tantalum comparison, Carbon and Hydrogen checks)
Last modified: 07/28/09