Meeting #124
Comparison of the data to the theory:
In the last couple of months we made some progress related to the comparison
of our data to the simulation. A "trustworthy" comparison is the last thing
that is missing before publishing our results.
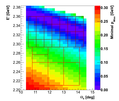
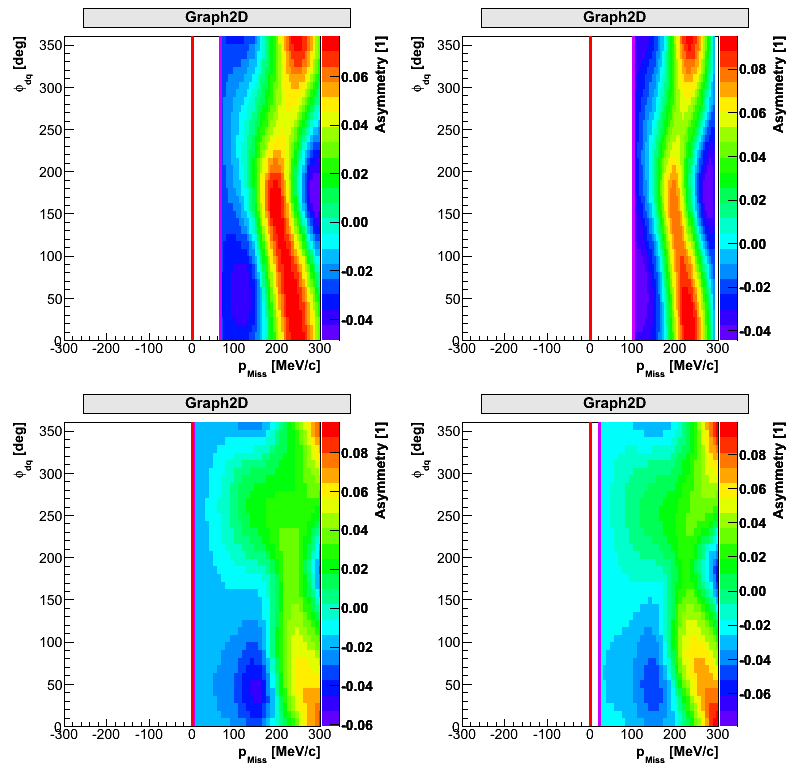
The theoretical groups have provided us with calculations for 35 kinematic points
distributed over the whole acceptance of the HRS spectrometer. Each kinematic
point represents one combination of (E',\tehta_e) . For such pair the (e,e'd)
asymmetries are calculated as functions of pmiss and phi_{dq}.
Old procedure:
To compare the theoretical calculations to the data, the following averaging
procedure was first considered. Using real data we determined all important kinematic
variables: E', theta_e, pmiss, phi_{dq} for each event. Using this information we checked
if theory is available for every considered particle using following approach:
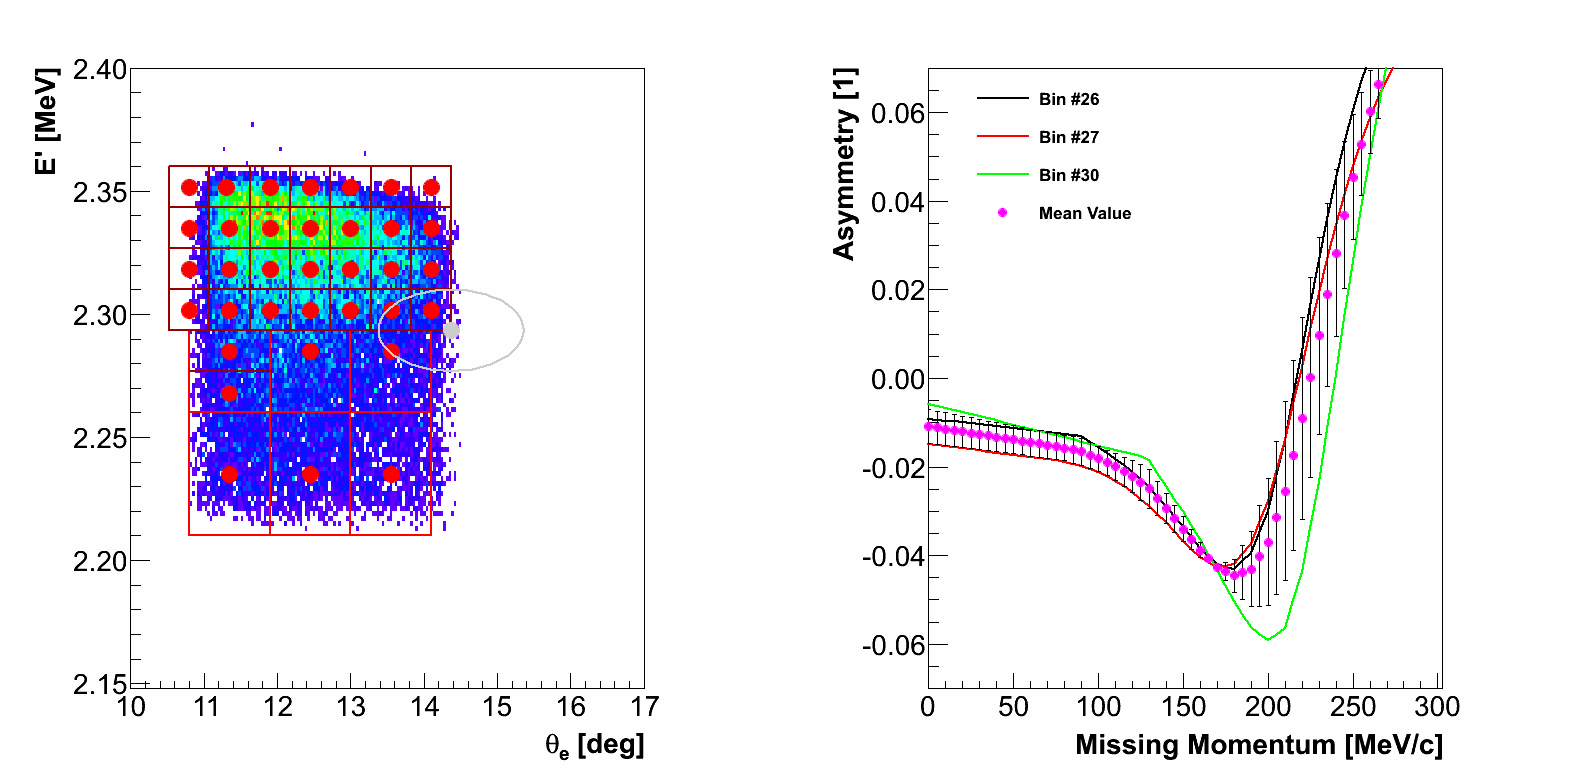
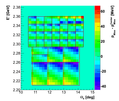
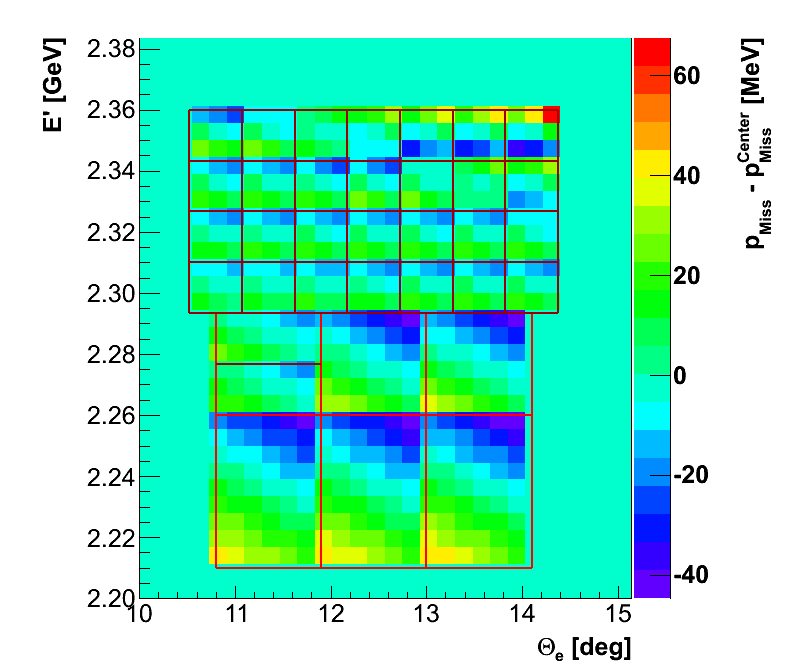
Each of the theoretical points represents a center of a kinematic square. If
events lies inside a given square, then theory at the center is assigned
to it. After selecting the kinematic point we had to check if calculations
exist for a given pmiss. Not all pmiss are available in all kinematic points.
If the calculations exist then we accept event and calculate the theoretical
asymmetry for a given set of kinematic variables.
To determine the final theoretical asymmetry as a function of missing
momentum, the asymmetries for all events in given pmiss bin were
averaged.
The experimental asymmetry was determined by using only those data
for which theoretical calculations exists. Such procedure was chosen to ensure
faithful comparison of the data to the calculations.
1.) 
Later we realized that such procedure has many handicaps. By selecting
only events that can be equipped with the theory we loose a huge part
of the measured statistics. Furthermore, when calculating the theoretical
asymmetry we always consider particle as it would come from the center
of the bin, which bring certain problems, especially because our kinematic
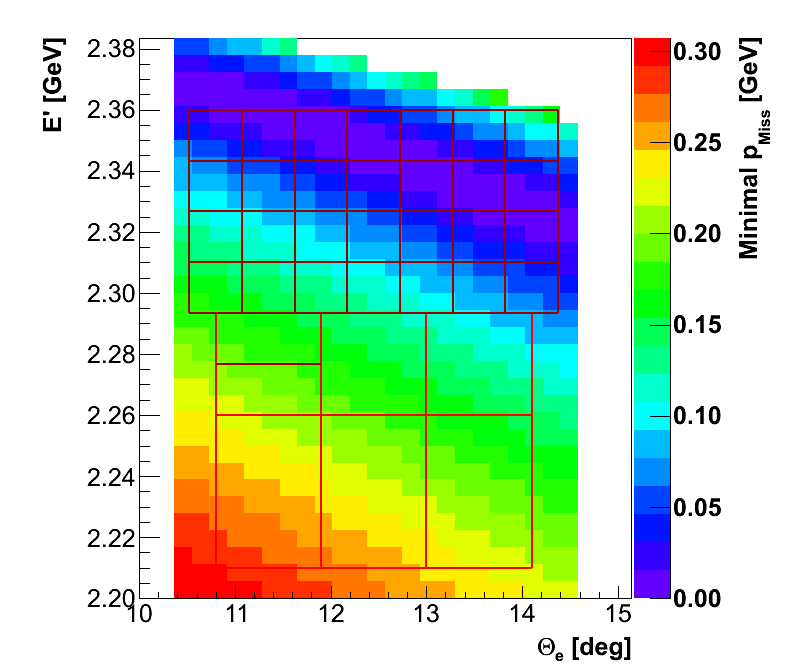
bins are still reasonably large. In particular, after performing a detailed analysis
we learned that in each bin, the minimal available missing momentum can
be up to 40MeV lower than minimal missing momentum available at the center.
This is problematic at low pmiss, because we throw statistics away. Additionally,
neglecting low pmiss data in some bins can lead to different final average value.
2.)  3.)
3.) 
Furthermore, if an event comes from an edge of a selected bin, the
theories from other three neighboring bins are equally valid as the one
chosen. Hence, we need to correctly decide which theory we going to
consider and why.
All these questions and problems have led us to the a new approach
for comparing data to the simulation.
New procedure:
The main goal of this new approach is to free the measured data of any unnecessary
cuts. Hence, we do not want to adjust data to the theory but vice versa. To keep the
comparison with the theory valid this means that we need to extend the pmiss range
of the calculations.
4.) 
This can be achieved by extrapolation existing theories to smaller pmiss. This is
not trivial, because Asymmetries have very nonlinear pmiss dependence. However,
we need to keep in mind that we need to extrapolate only for approx. 20MeV,
which should not cause a dramatic change in the asymmetry.
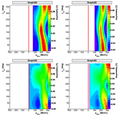
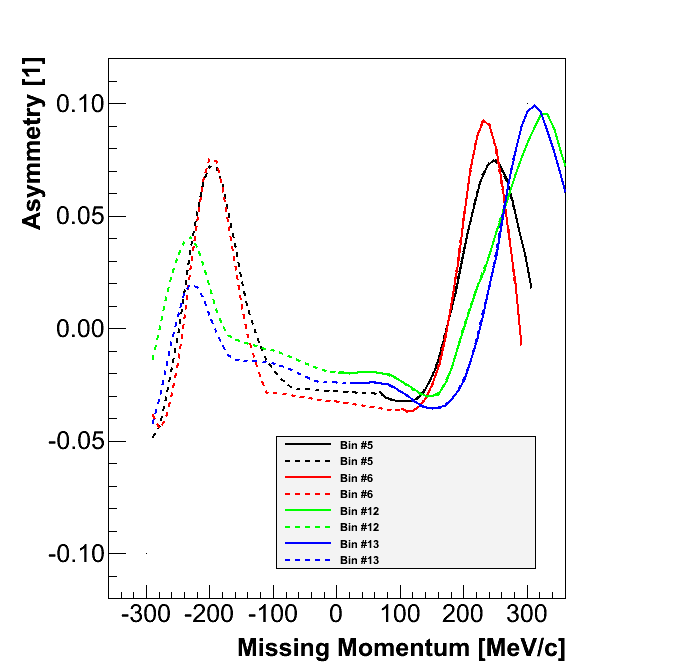
To get best possible guess for the asymmetries in the low miss region we exploited
the fact that A(-pmiss, phi_dq) = A(miss, 180+phi_dq). Using this mirroring of
the asymmetries to the negative pmiss-axis the extrapolation of the asymmetries
turns to a more reliable interpolation over the y-axis. Of course, here we assume
that asymmetry is stays humble, which is indeed the case. This is evident from the
theoretical calculations for the bins where asymmetries at very low pmiss are
a priori available.
5.)  6.)
6.) 
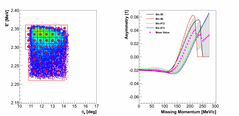
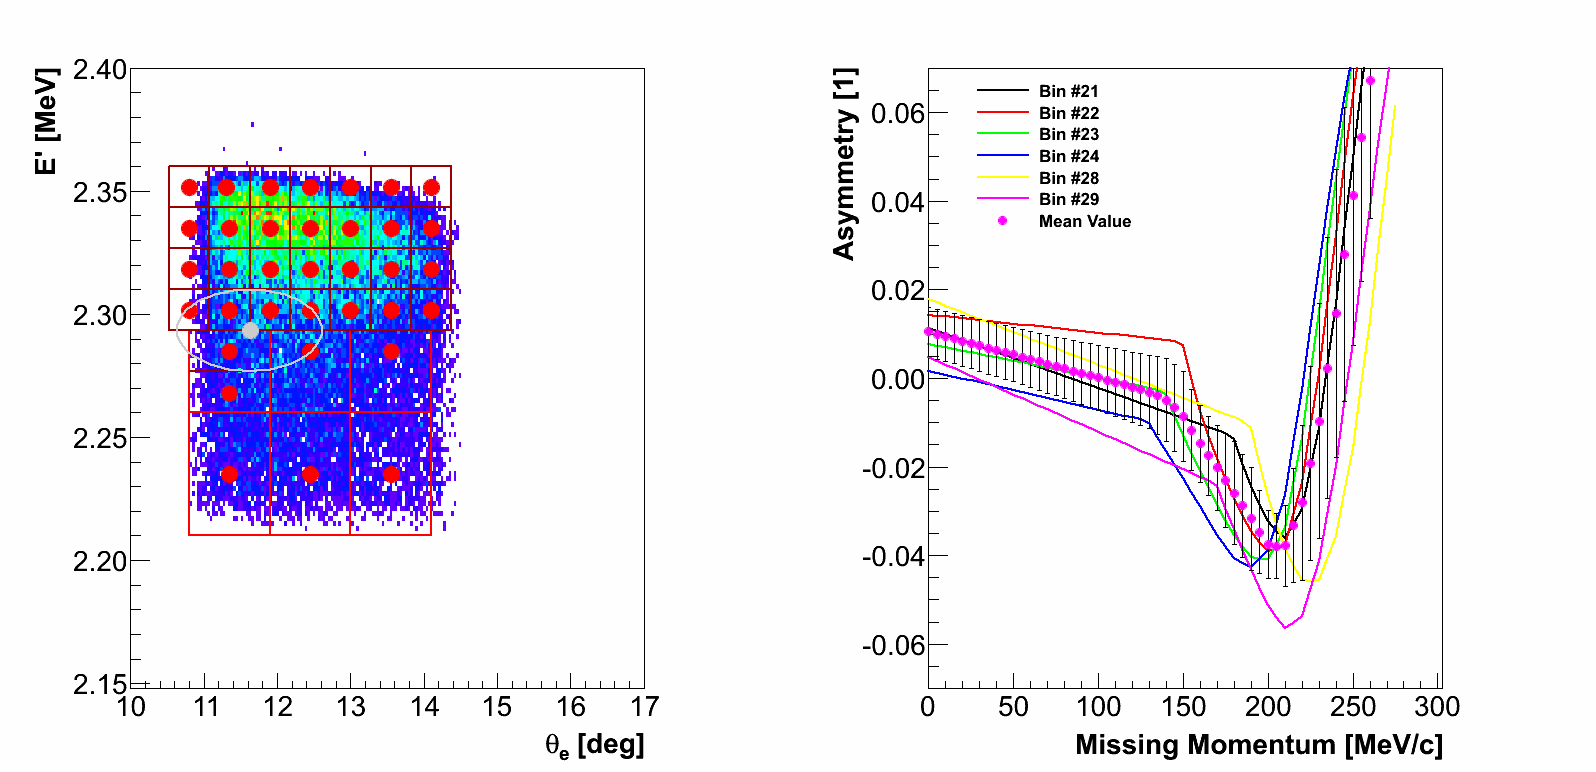
Once having the theory available for all required pmiss, we went a step further
and considered not only one theory at the center of a given kinematic
bin but also the theories for the neighboring bins.
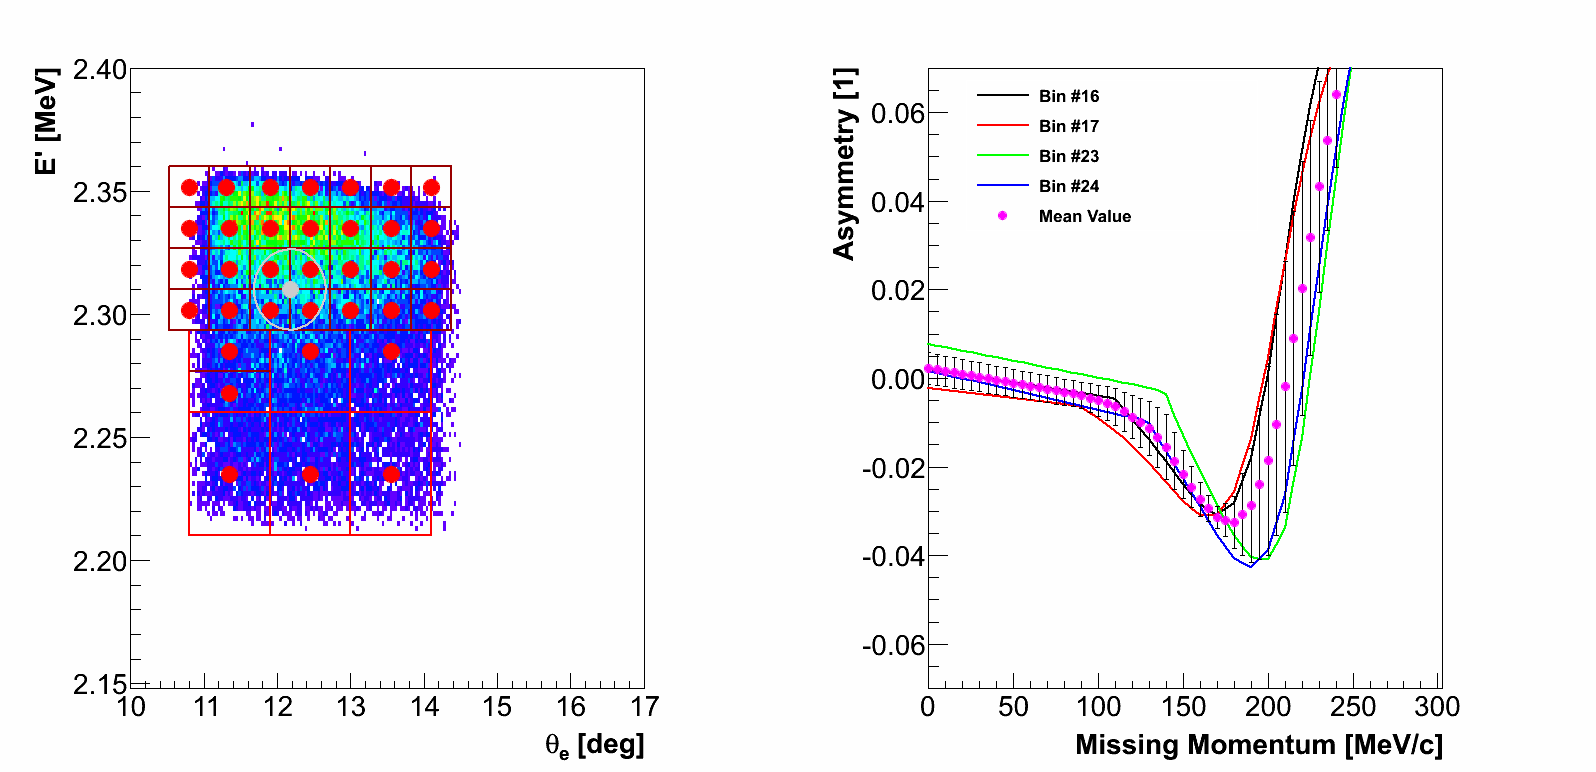
In this approach we selected a epsilon-surrounding around each event. Its size
was chosen such that for each event few closest theories are selected
(the radius of the surrounding approximately agrees with the size of one
kinematic bin).
Then we check which theories are available inside selected zone, e.g.,
if event sits right on the edge of a bin, algorithm selects theories for all four
closest bins.
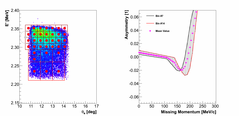
Once we determined which theories are inside our zone, we calculate
the distance from the event to each of the considered bin centers. These
distances are then used as weights in the calculation of the average of all the
theories available inside the selected zone. Larger distance means smaller
contributions of a particular kinematic point to the average asymmetry. Together
with the average we can also determine the uncertainty(sigma), which is estimated
as the difference between the mean and the closest theory. This sigma is a measure
for the uncertainty of our theory. This uncertainty
is not in any way related to the quality of the theory provided by the theoretical groups,
but is solely consequence of our averaging procedure and the fact, that the
theory is available only in few discrete points of the acceptance.
7.)  8.)
8.)  9.)
9.)  10.)
10.) 
11.)  12.)
12.)  13.)
13.)  14.)
14.) 
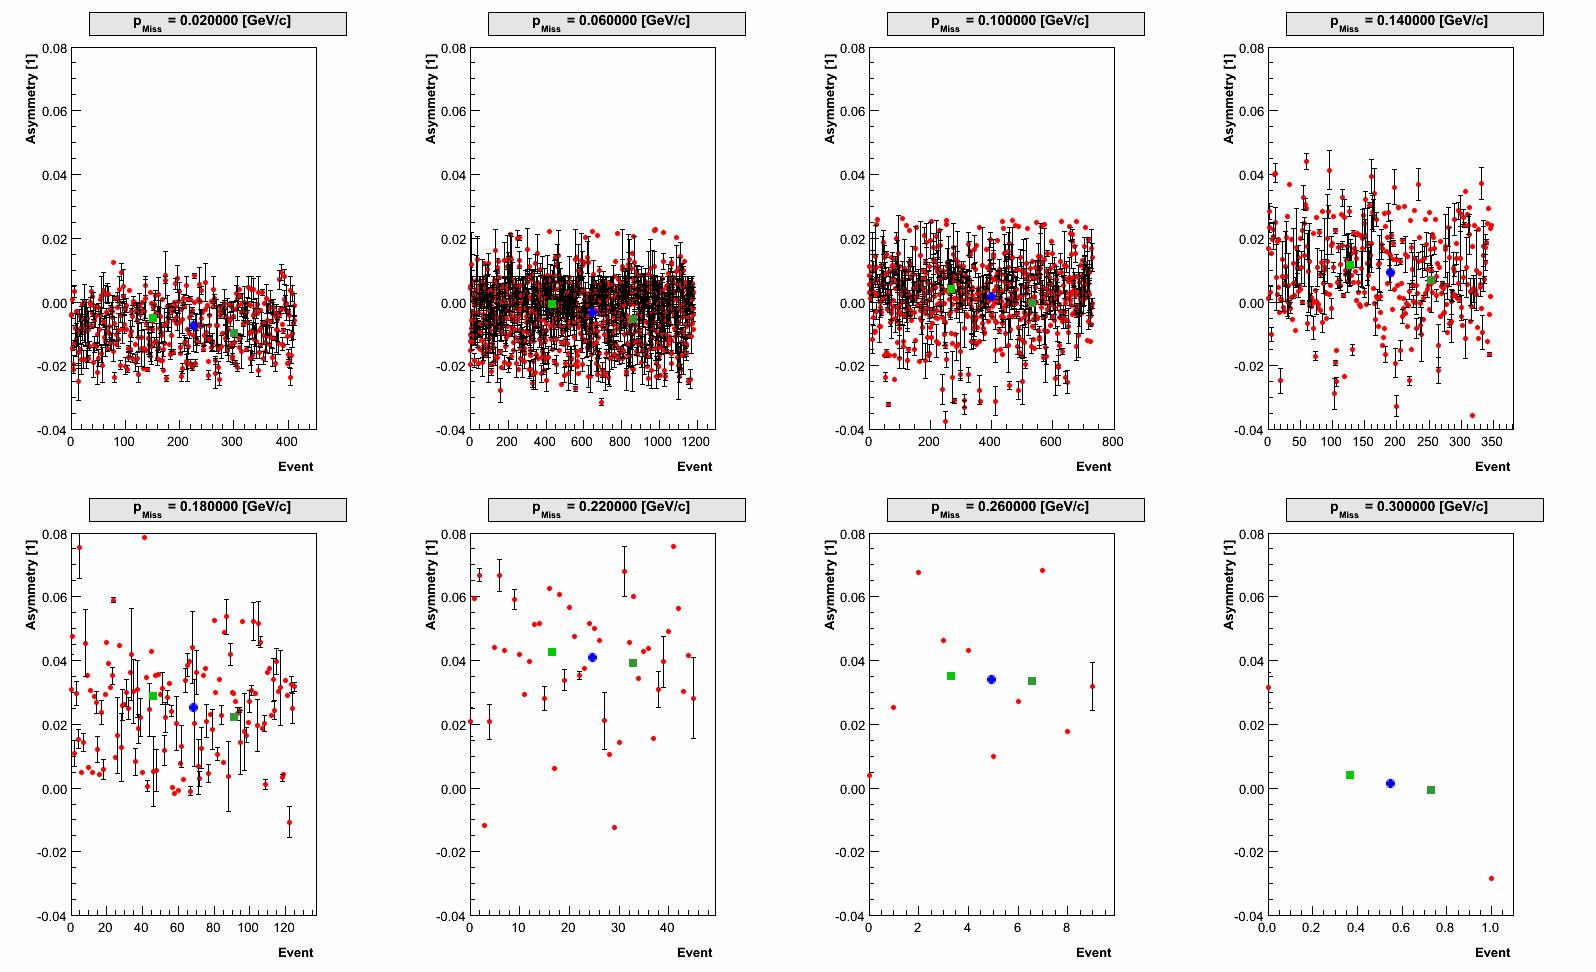
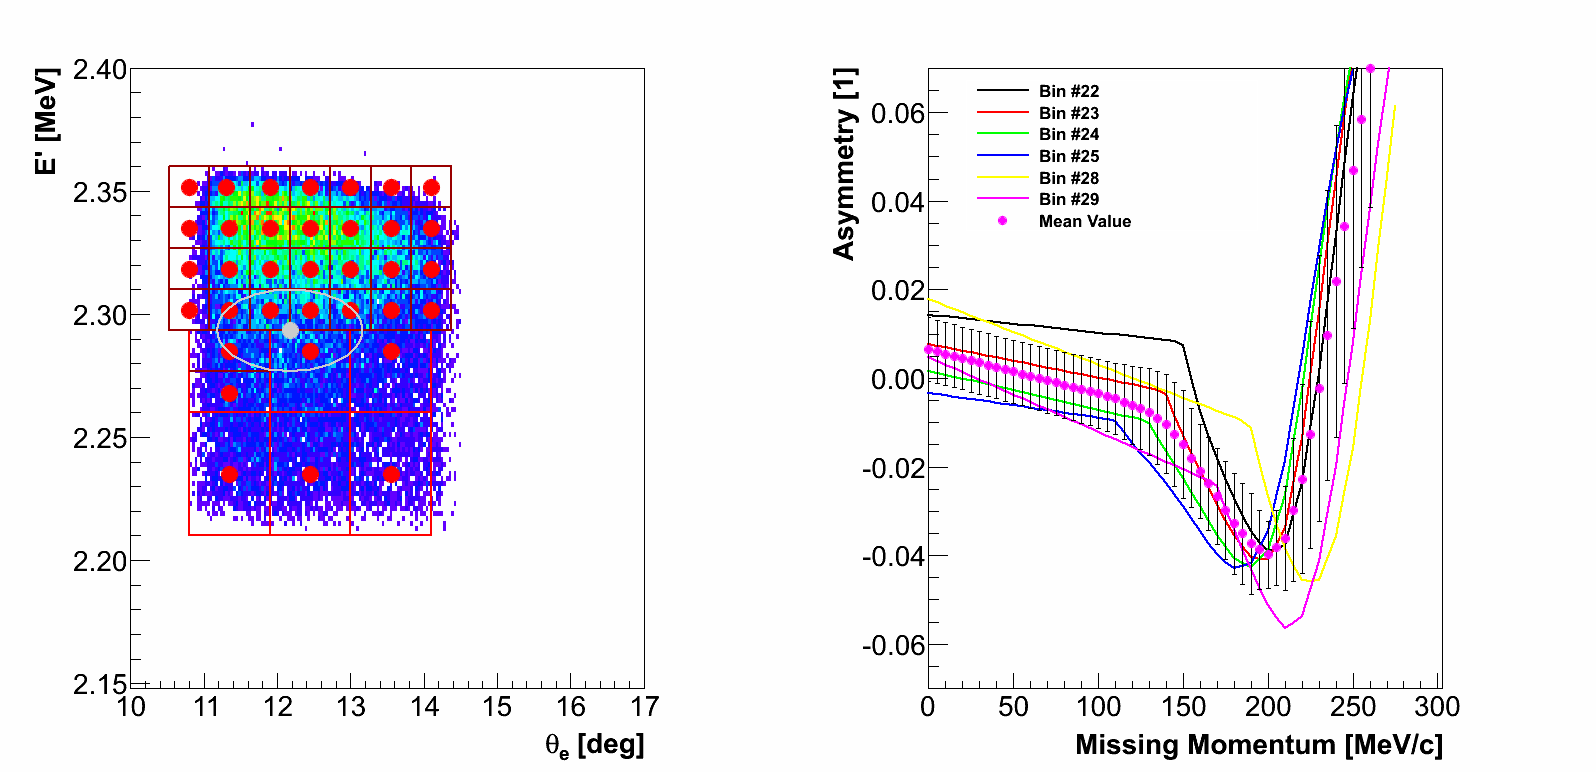
We perform this algorithm for each event. Similarly as before, we gather these
asymmetries in different pmiss bin and in the end calculate the average values,
to perform the final comparison of the data to the simulation.
15.) 
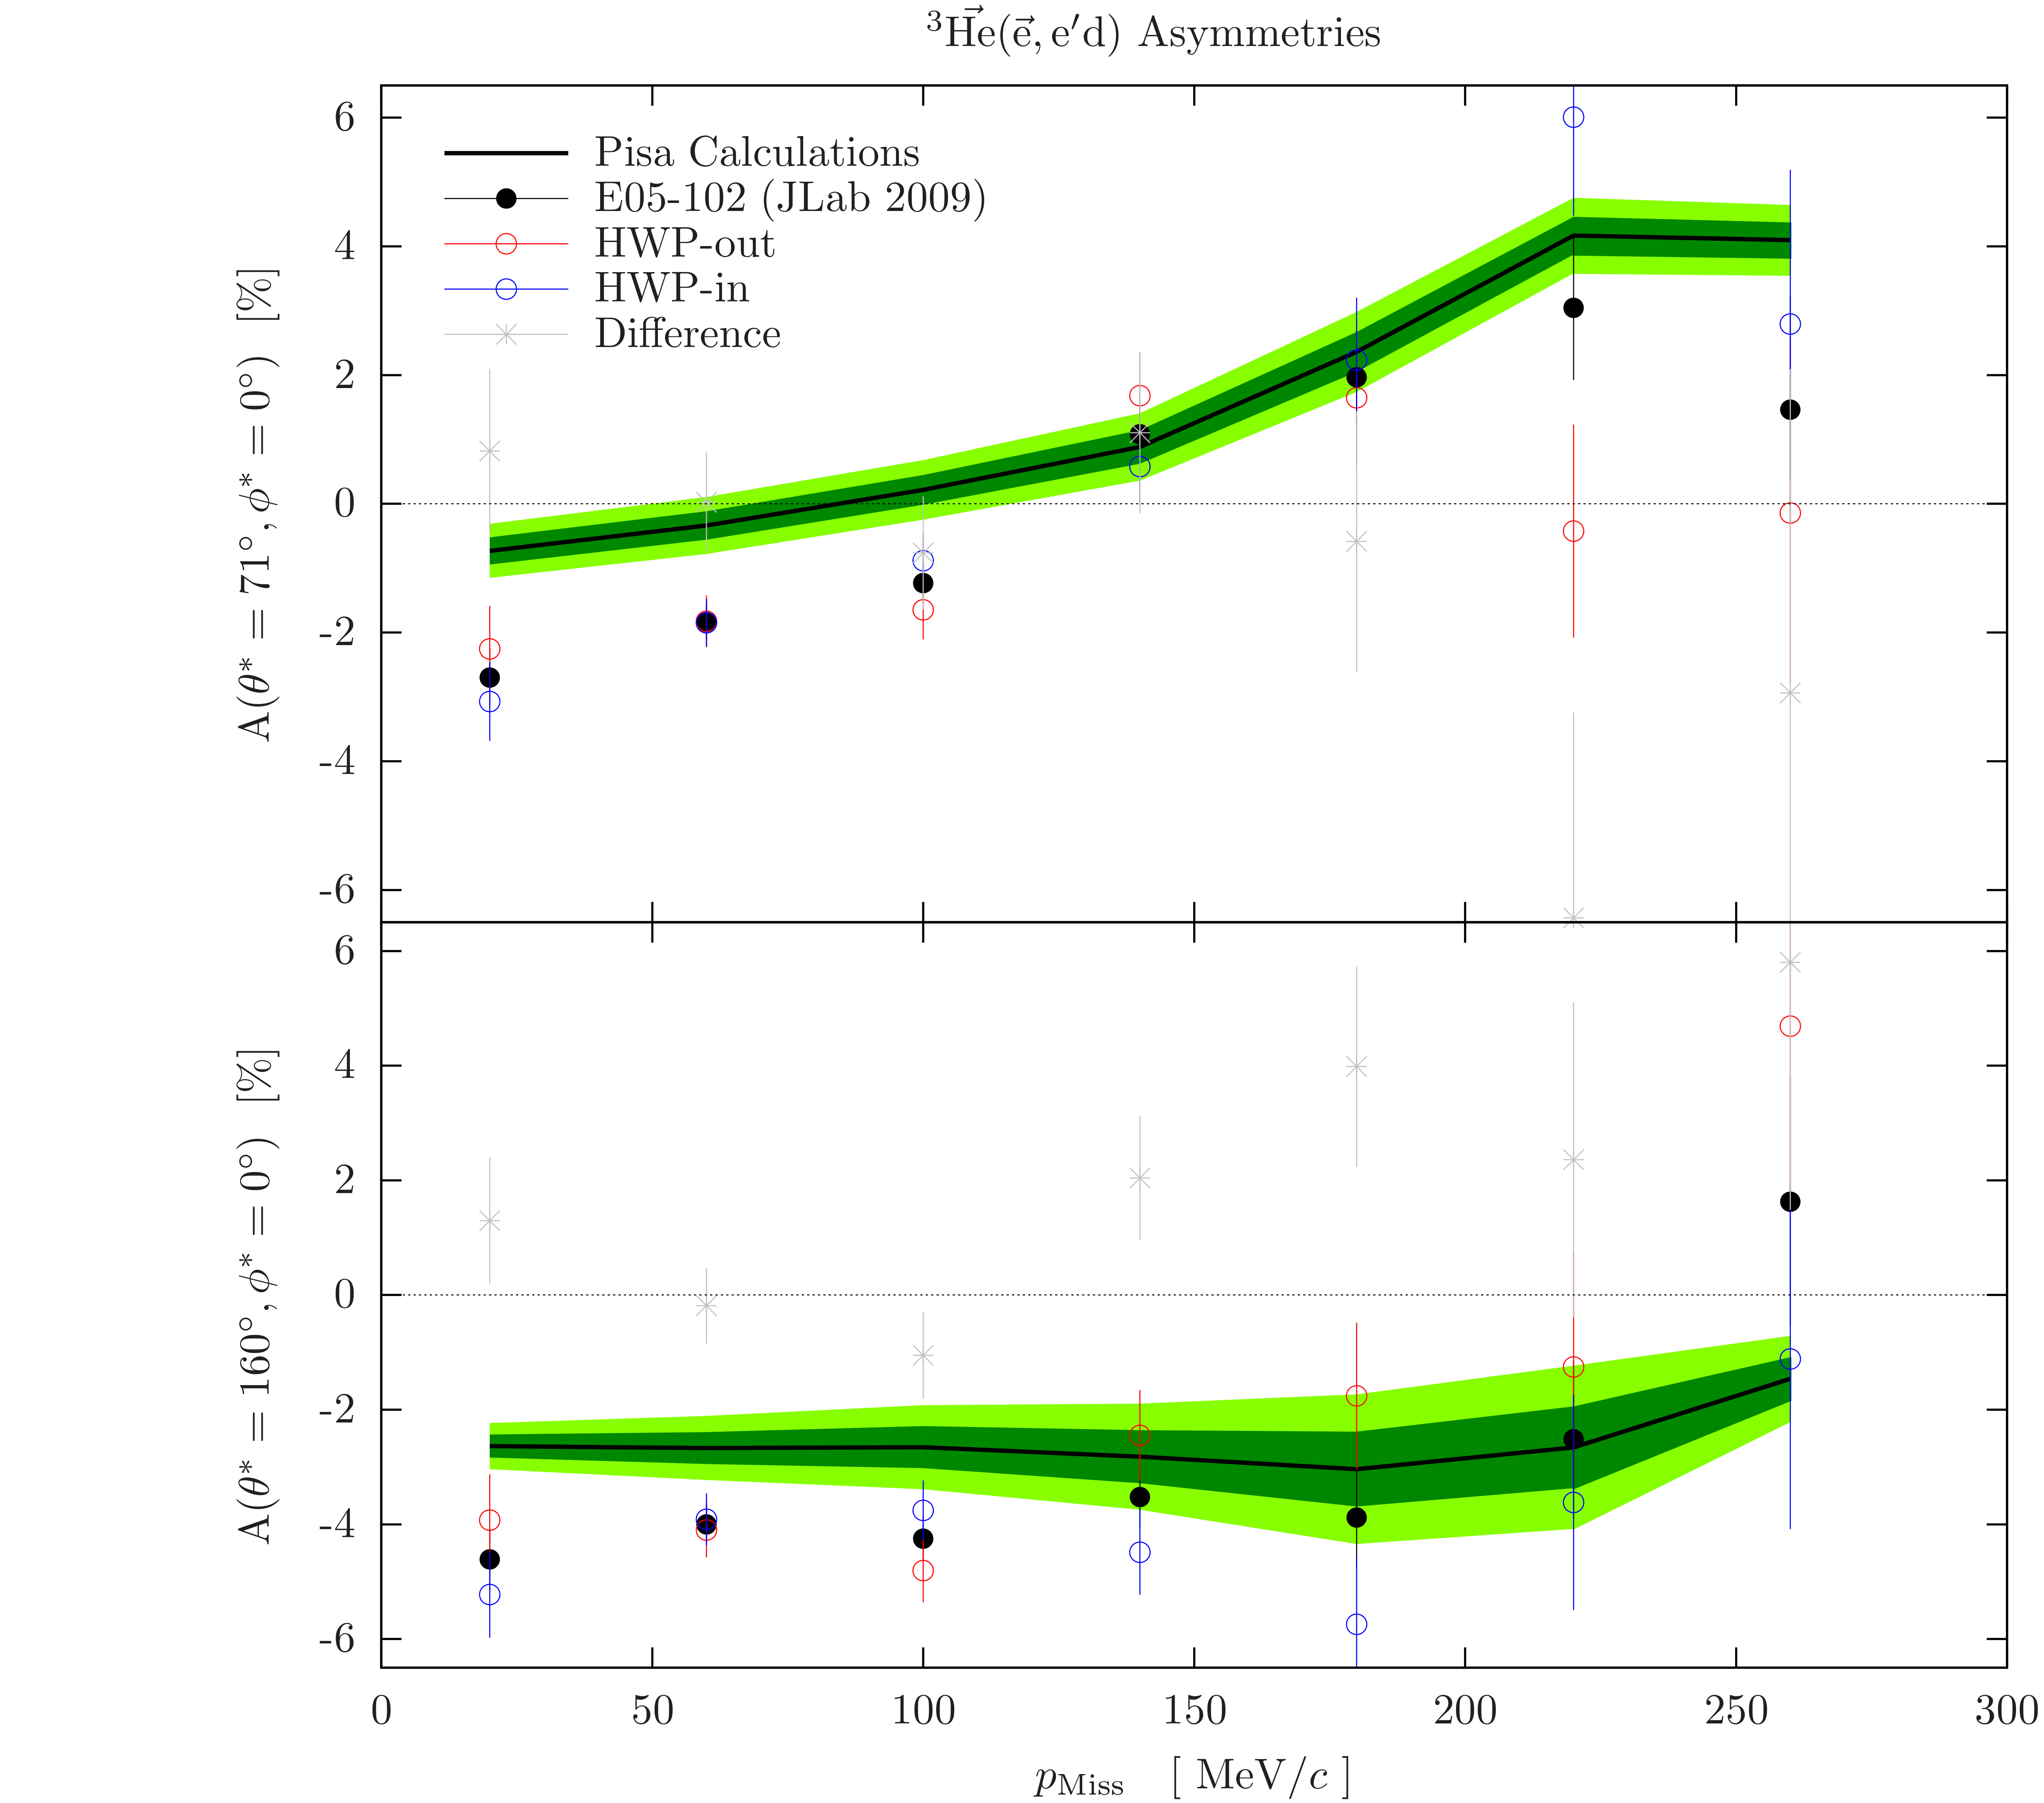
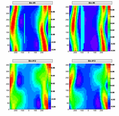
New results:
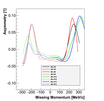
The new approach for averaging theory over our acceptance resulted in the following
comparison of the theory to the data:
16.) 
Last modified: 12/03/13

 3.)
3.) 
 6.)
6.) 
 8.)
8.)  9.)
9.)  10.)
10.) 
 12.)
12.)  13.)
13.)  14.)
14.)