Cultural introduction - France Preseren:
Today we have a national holiday. We celebrate a death of our
greatest poet France Preseren.
http://en.wikipedia.org/wiki/France_Pre%C5%A1eren .
3He(e,e'd) Analysis
Spot issues:
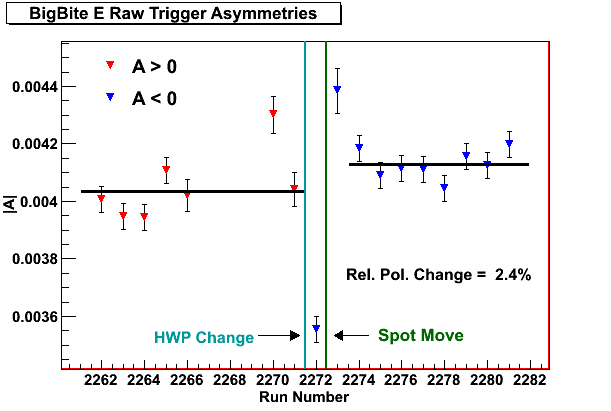
Seamus's plot:
Seamus noticed the jump in the asymmetry during the experiment,
after the spot was moved:
01.) 
This is a very small change. We are "looking" for a larger correction.
Spot moves:
Here are the ELOG entries that I was able to find about
the spot changes:
02.)  03.)
03.)  04.)
04.) 
05/15/09:
=========
The halls reported slightly lower polarization....and I think they didn't want
to do another Moeller measurement later on, so we agreed to spot move today.
Before spot move, the tools page Figure1 shows where attnuators were running,
and transmission. We've been running from x/y=970,960. I moved to
x/y=920,1025. The first time, the steering script didn't work. So I backed out
and intialized the steering matrix. Then the script worked. The spot at viewer
7 upstream of A1 looks a bit oblong but this is probably because of the Wien at
67 degrees, and not the fact that we're running from the edge of the
photocathode. Figure 3 shows attenuators and transmission from new spot.
Attenuators are low and certainly good enough for the weekend. Transmission
could be a bit better at A1.....
05/20/09:
=========
Running out of QE and laser power so time to do a spot move. But first, we QE
scanned to assess the number of available spots. QE is disappointingly low
about everywhere. We moved from 920,1025 to 830,1000. We can now run
comfortably but probably a good idea to heat and reactivate the photocathode
tomorrow during RF recovery.
Spot move went smoothly. Good transmission. I ran the QE measurement tool.
05/28/09:
=========
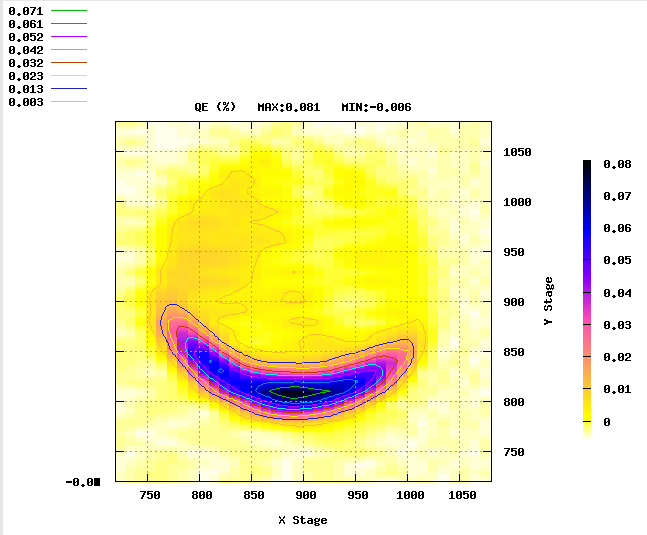
The QE Measurment script reports the Hall A QE is ~0.063%. Unfortunately, the
script is sensitive to how quickly the picoammeter readback responds, i.e., bad
samples can be included in the average resulting in an artificially low reported
value. Sometimes, like yesterday, it's obvious (script says 0.001%, we measured
0.14%). Other times, like today, it's like (script says 0.063%, we measured
0.081%). I'll see if we can improve the discrimination of bad samples into the
calculation, but my sure-fire method is to take ~5 min. to check the QE "by
hand".
With present QE and attenuator <200 I've recommended we run until Thursday's BS.
Then, we'll make a QE scan of the wafer and move to a new spot. If ever we
find there isn't a sufficiently good spot to use then we heat and activate,
which takes ~9 hours.
05/29/09:
=========
Terminated beam, initialized spot matrix to FC1, moved from 950/875 to 850/850
(see Fig. 1), spot-move-steered OK, reduced Hall A attenuator from 300 to 140 to
make 11uA. The attenuator looked OK (see Fig. 2), but anticipate this should
set us up OK for the entire weekend, hopefully longer.
Probably?, a heat/activation next Thursday, but we'll re-evaluate next week.
06/01/09:
=========
The QE at the present spot 850/850 is ~0.01%. The Hall A atten is ~325 and at
the rate of growth we'll be fine through Tuesday (see Fig. 1). On Tuesday
we'll move toward 900/825 which will boost QE sufficiently to run through
Thursday, when we'll need ~9 hours to heat/reactivate the wafer. Based on the
last heat/activation cycles, this should just get us to just about the end of
the Physics run.
06/02/09:
=========
0810 - Start spot move. At 850/850 AttenA=410 makes 10uA. Calibrating spot
matrix.
0815 - Moved to 900/825 (see Fig. 1). Spot move A-OK. Now, AttenA=165 makes
10uA.
06/04/09:
Spot moved to the "right side" of the freshly activated wafer. The steering
script worked very well. We are at x/y=975,940.
We verified we could easily provide 70uA from the fresh photocathode with
attenuator at just 120. THere was loss on apertures, so when it's time to run
100uA for the test next week, we will need time to steer through front end to
avoid throwing beam away.
06/12/09:
=========
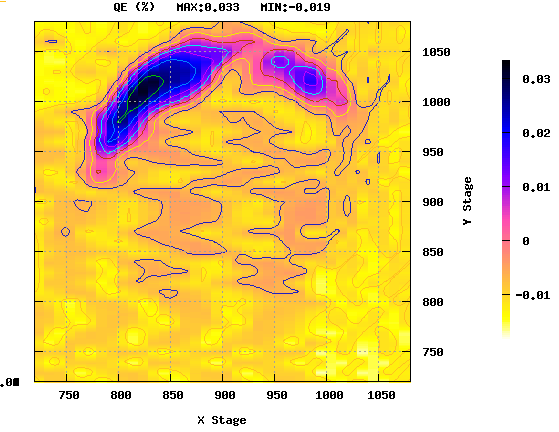
0730 - Terminated beam for a QE scan. We've been running at 975/940 for ~1 week
making 3.16C w/ a ~1.4C lifetime (see Fig. 1). QE scan shows trench directly
across from the spot we ran, perhaps related to FE geometry - appear real, not
instruments, but will verify on Monday. The EC looks to be around 900/1000.
0800 - After turning HV back on, had probs with 250V FSD comparator enable - it
tripped every few seconds for 5 min, settled down, OK after 10 minutes.
0815 - After moving spot, had difficulty restoring beam w/ spot-steer. The REL
orbit has become rather different, so I re-loaded the BPM offsets up to FC1 from
~June 5th post heat/activation and restored beam. I checked at viewers,
everything appeared OK. Initialized matrix again, moved to 925/1025, spot move
orbit OK. Generally, I found the steering would not converge - like a dead-band
problem? So, I waited until orbit looked OK, aborted script, then turned
steering upstream of Wien off and let script optimize through A1/A2. Checked CW
to FC1, good - low interceptions.
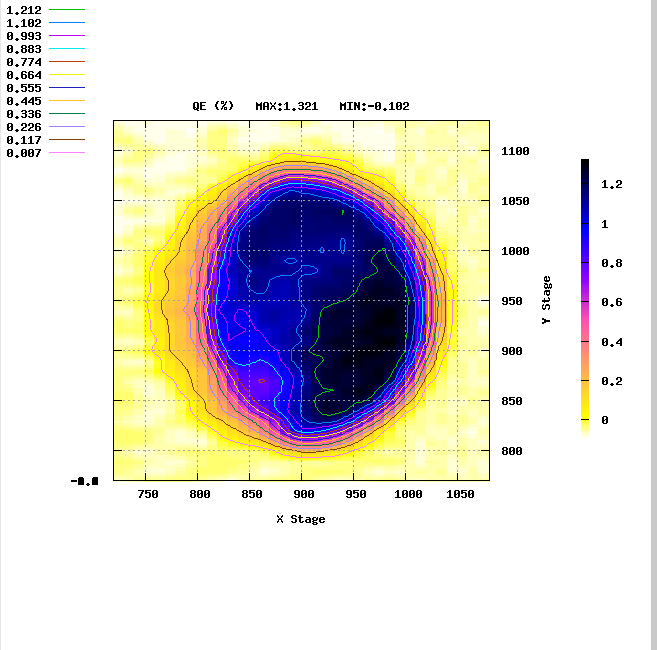
0830 - Finally OK, and beam back to Ops. Fig. 3 zooms in on upper-right wafer
region, QE ~0.02% at previous spot and ~0.1% now. We might have made it through
weekend at previous spot, but should be fine at present spot. It'll be
interesting to see how the left side of wafer reacts.
Change in the Asymmetry - HWP problem:
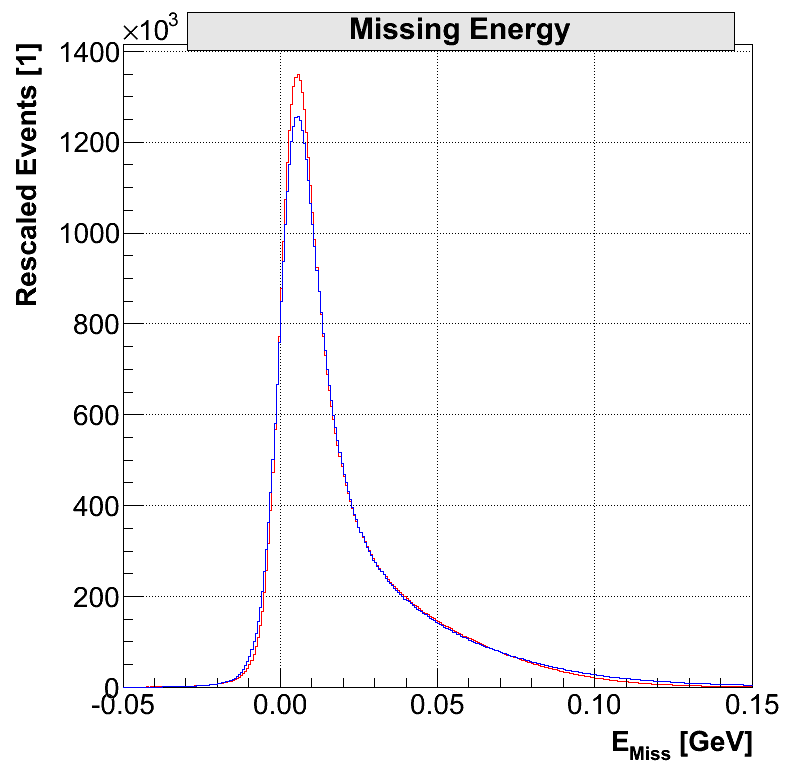
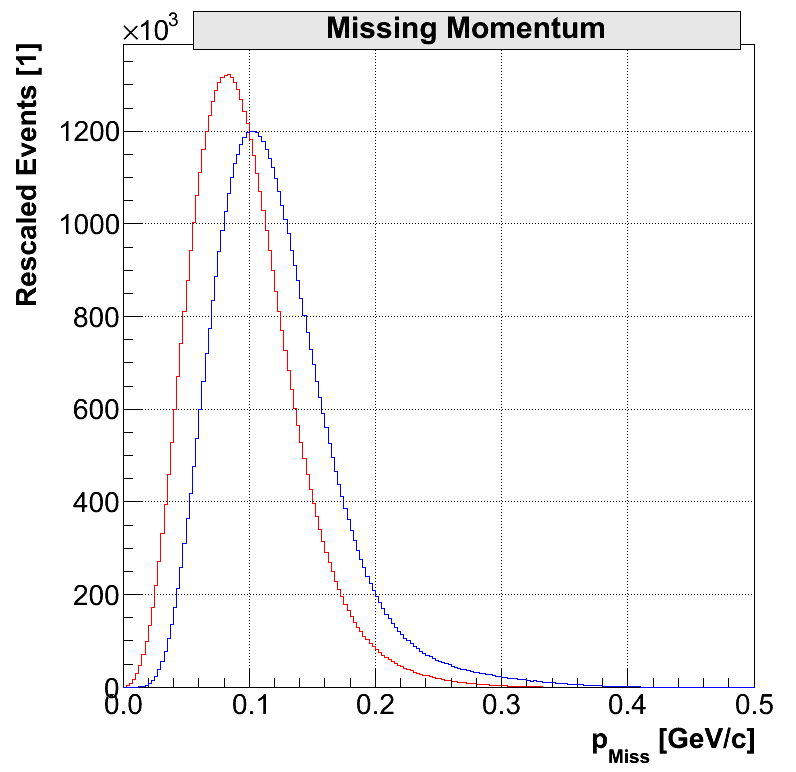
12.5deg vs. 14.5deg data:
Missing momentum and missing energy plots for both kinematics settings:
05.) 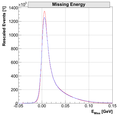 06.)
06.) 
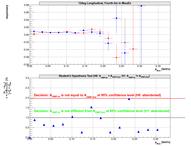
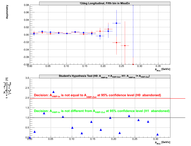
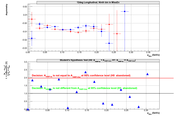
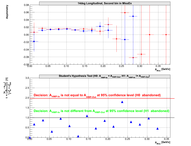
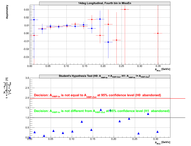
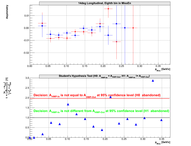
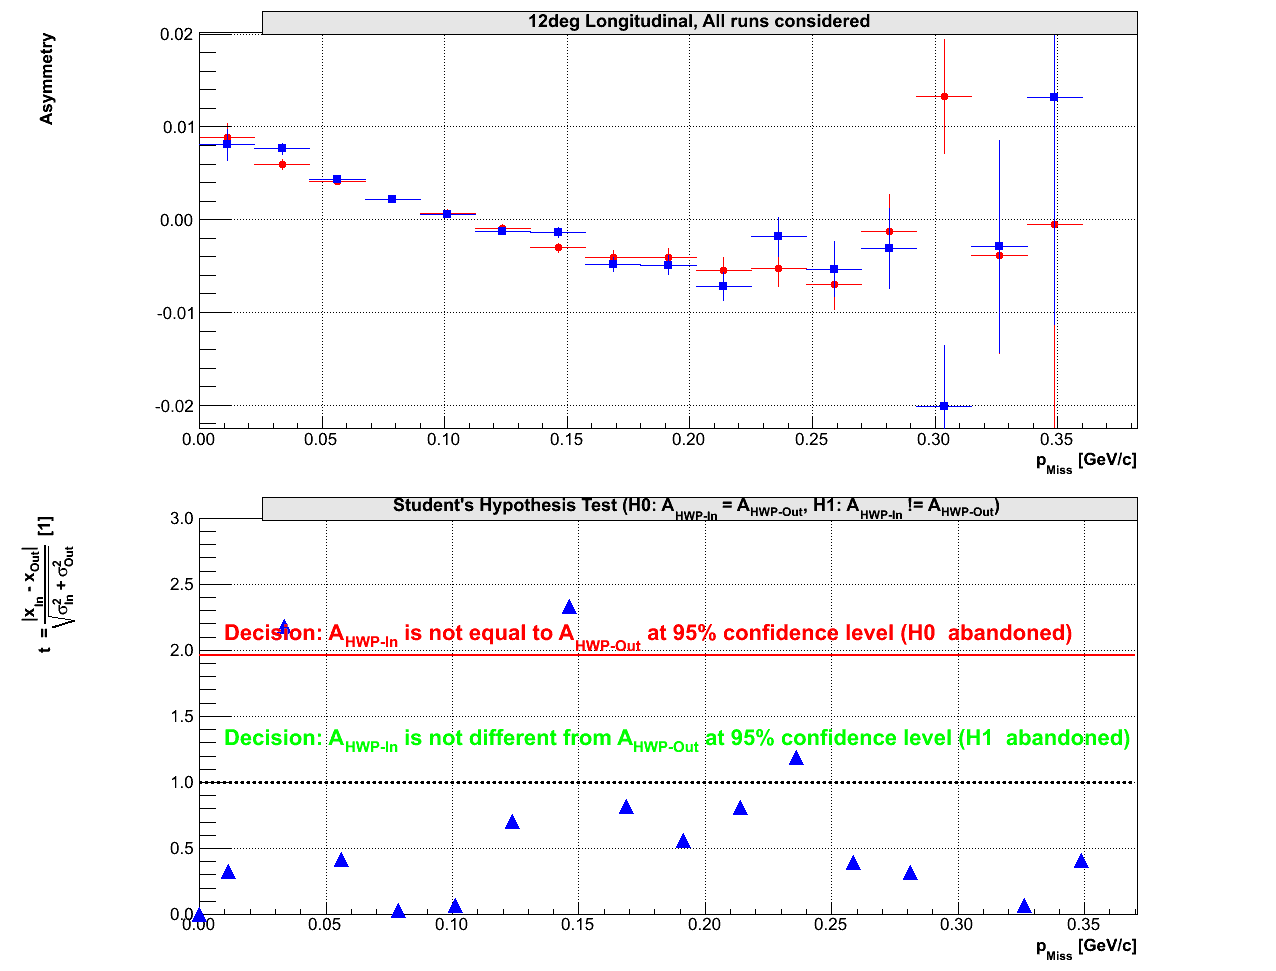
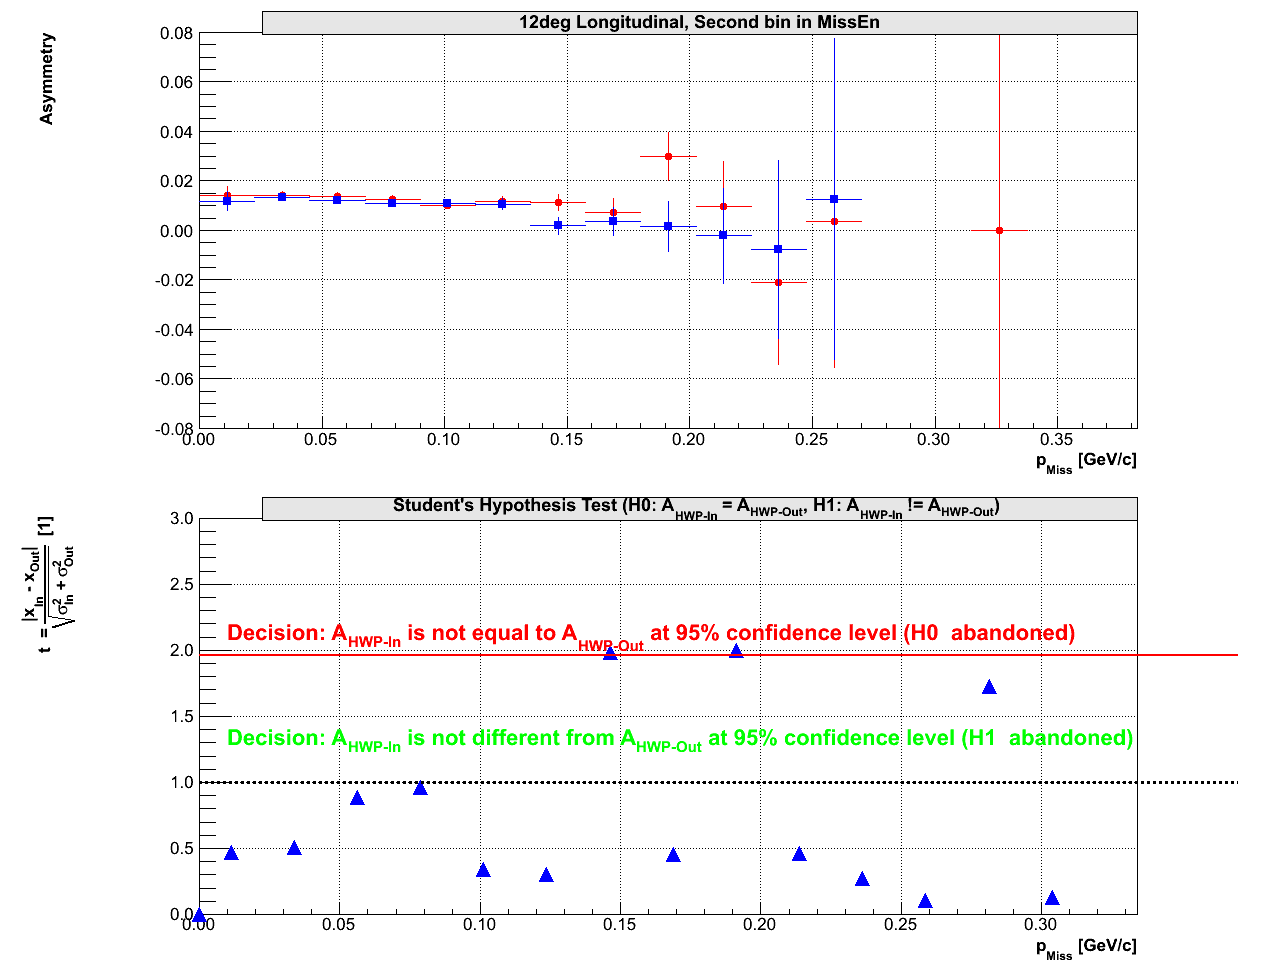
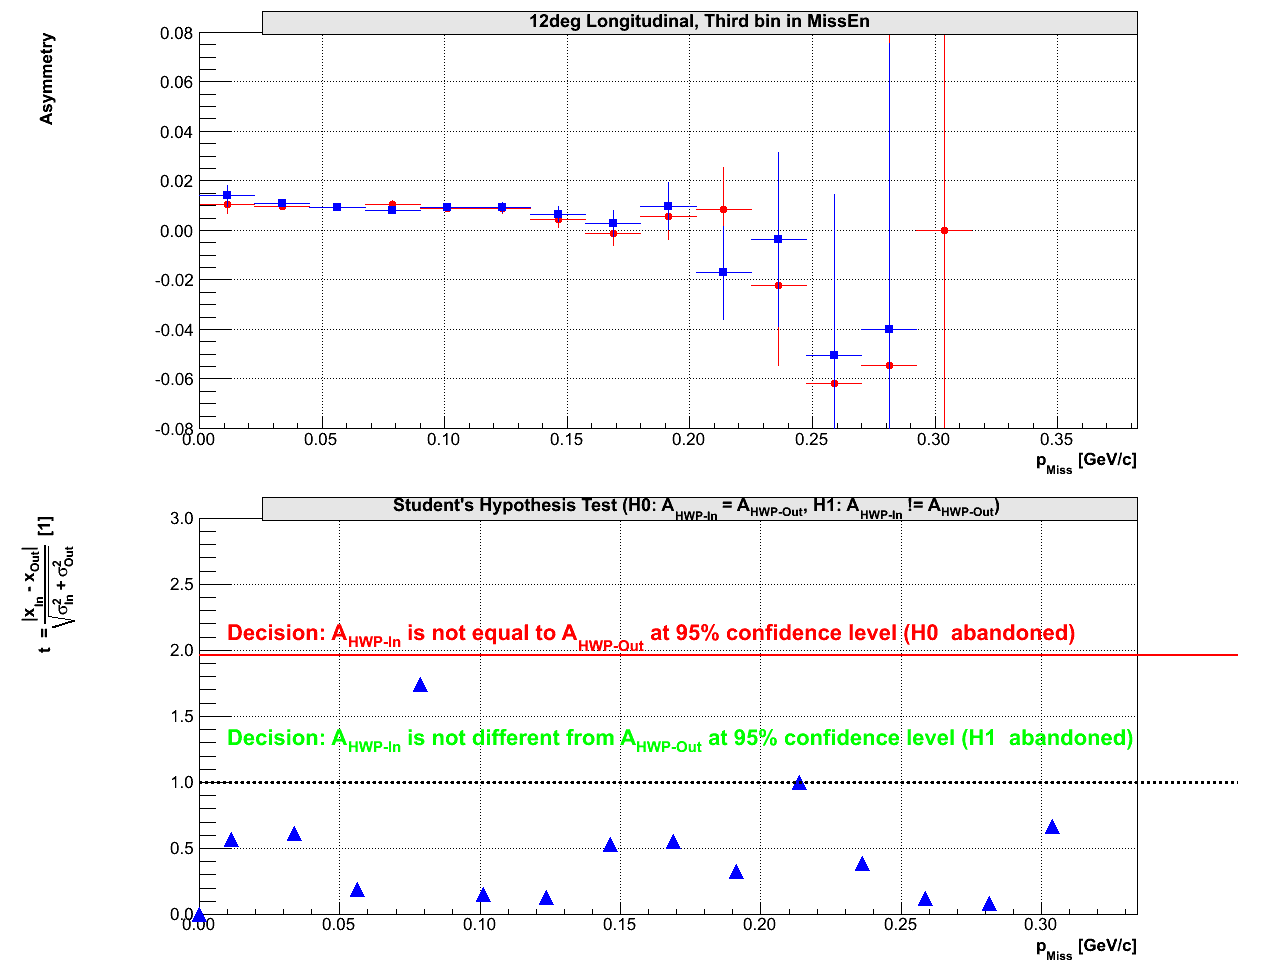
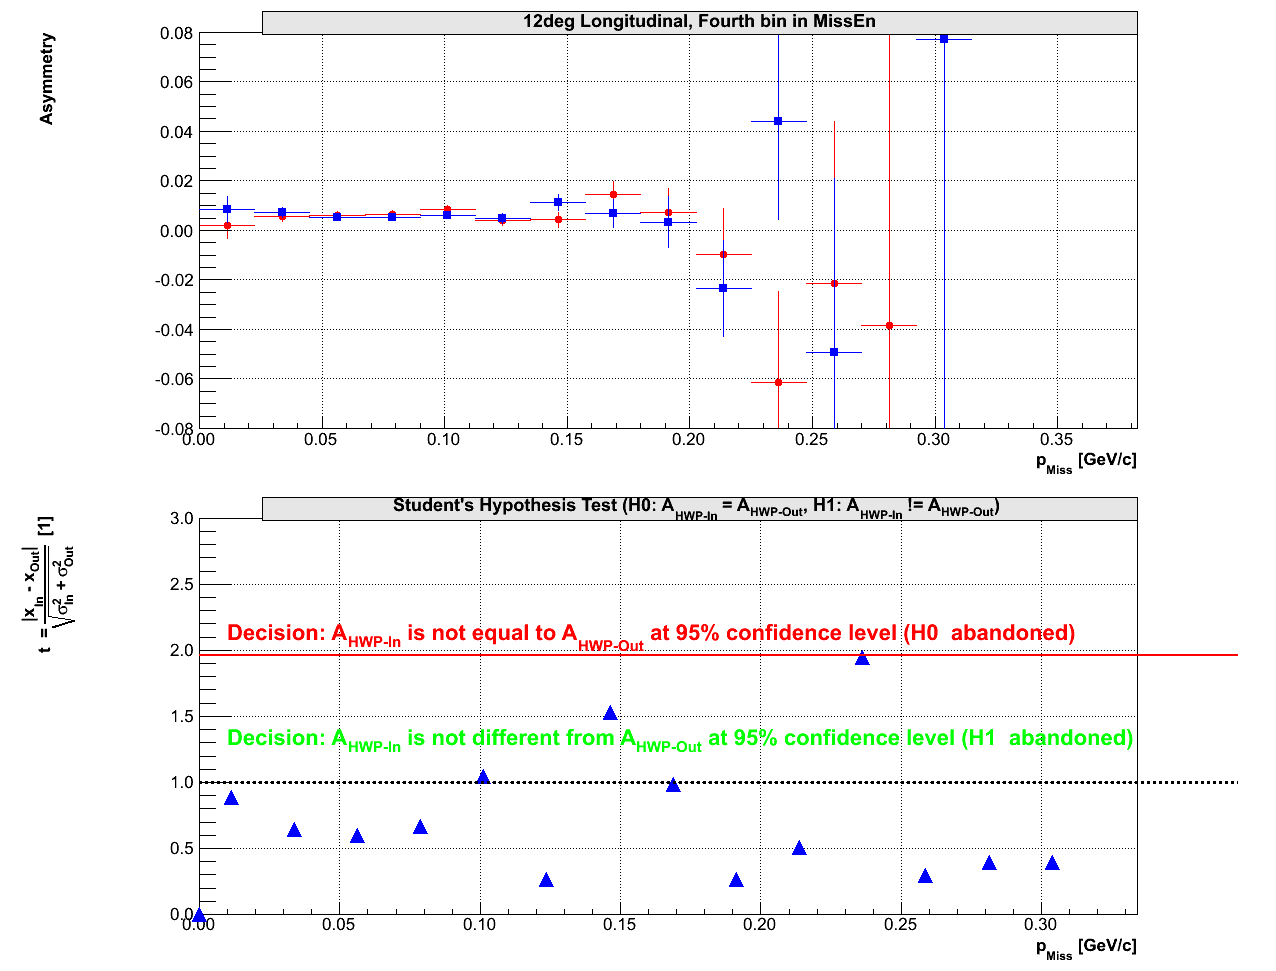
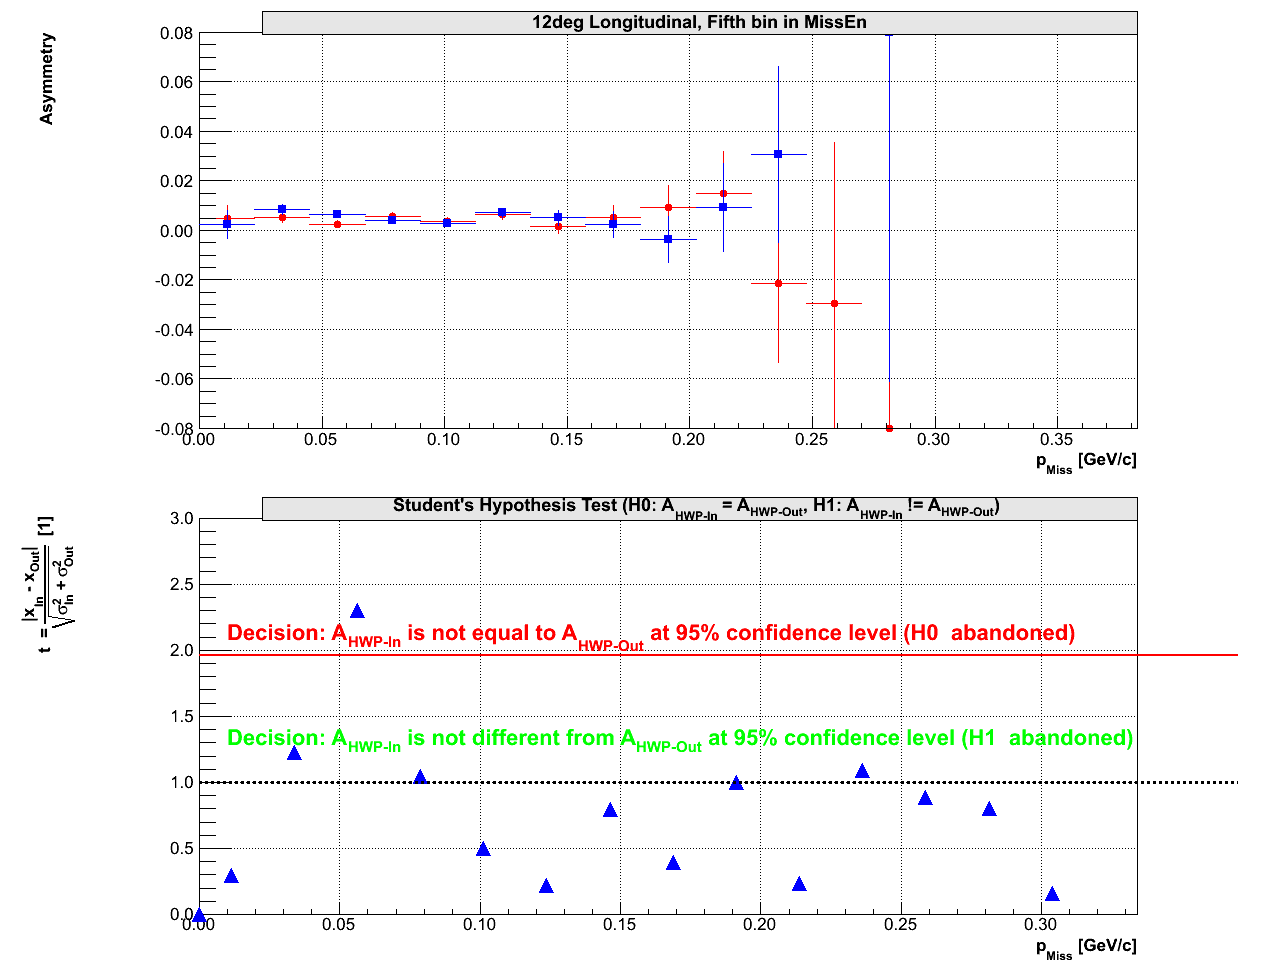
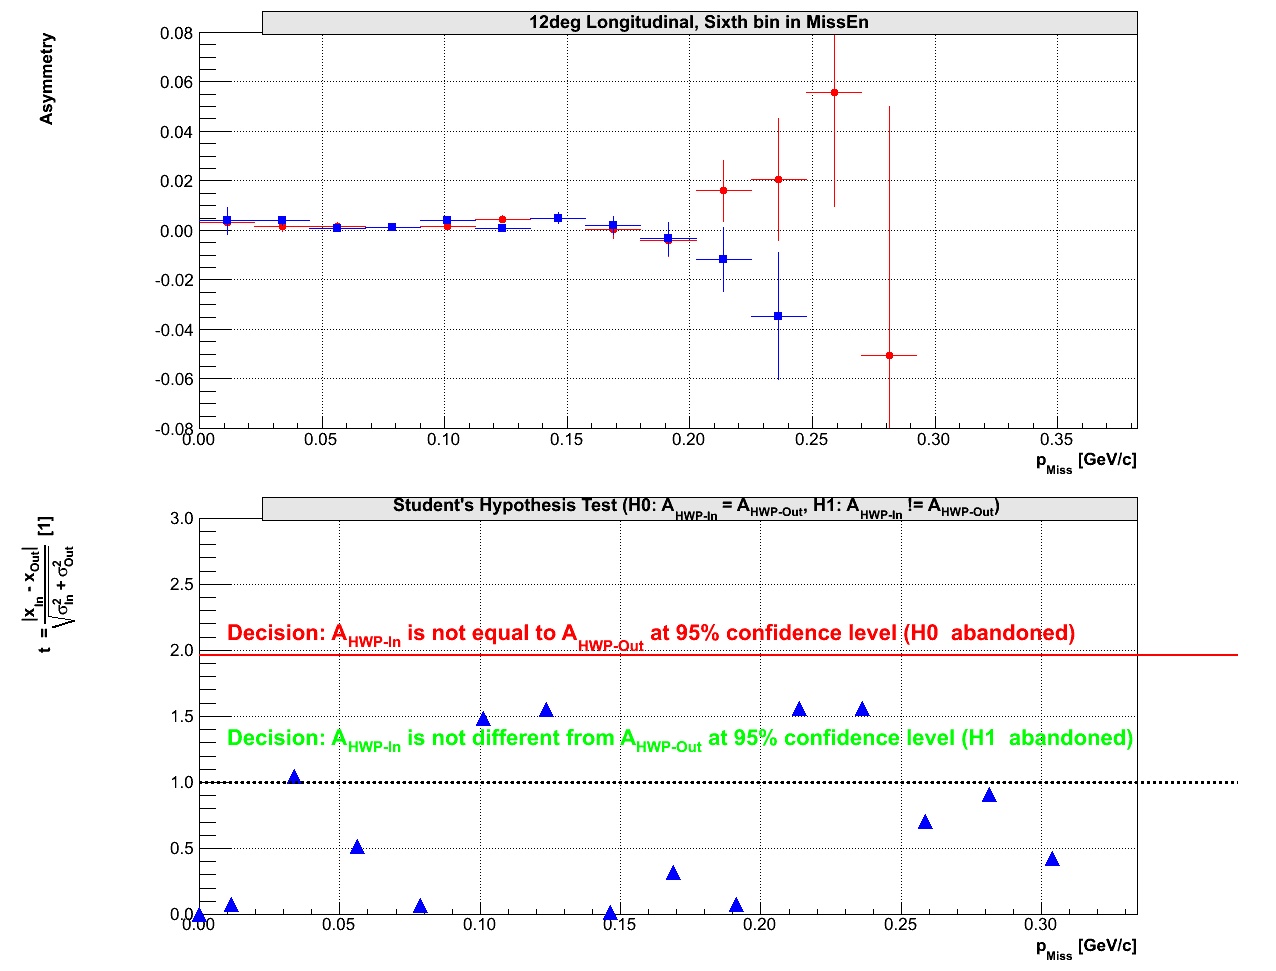
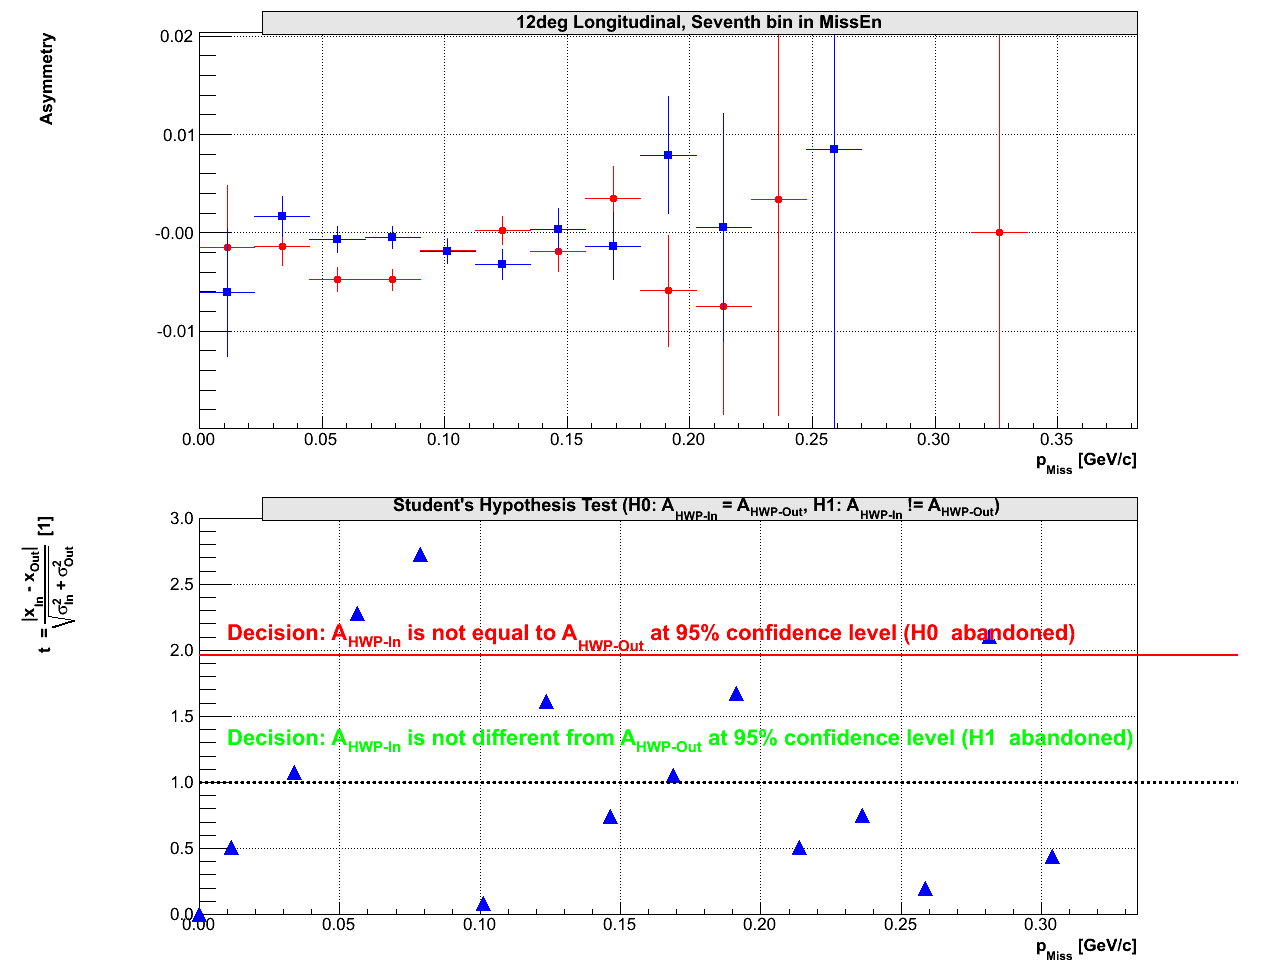
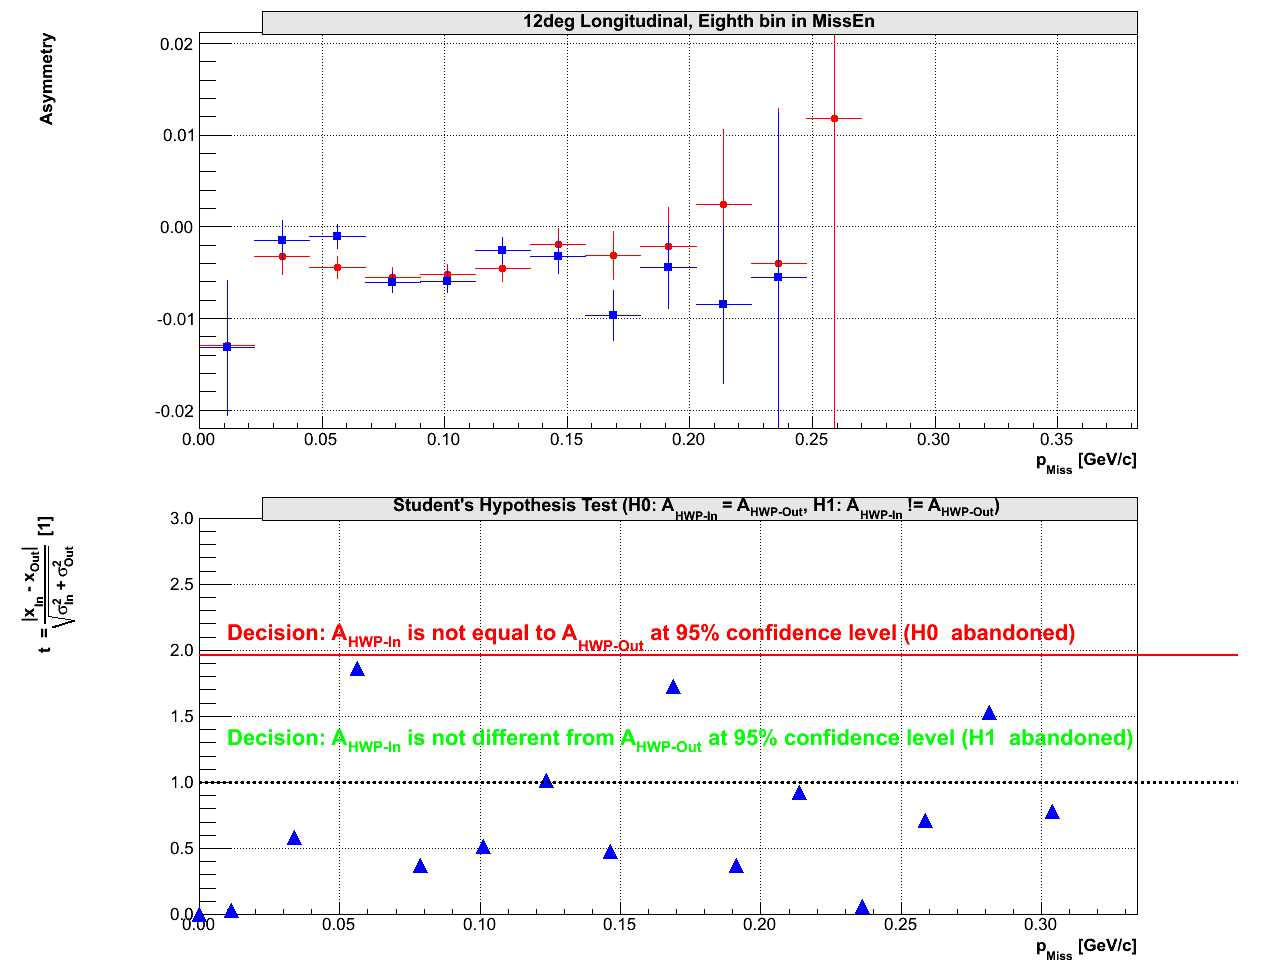
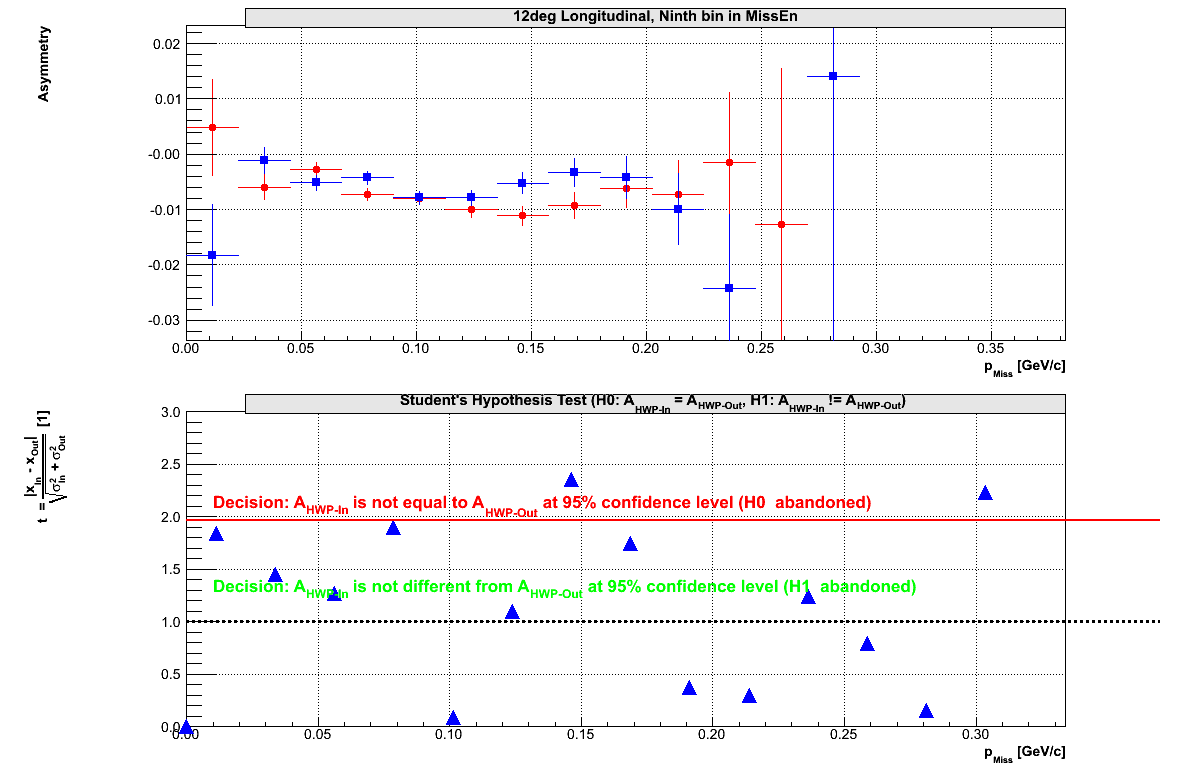
Student tests for 12.5deg data (raw asymmetry):
Try to determine if results for the data with HWP-in and HWP-out
are different. Using Student tests. I do not observe
statistically relevant discrepancy for this set of data:
07.)  08.)
08.)  09.)
09.)  10.)
10.) 
11.)  12.)
12.)  13.)
13.)  14.)
14.) 
15.)  16.)
16.) 
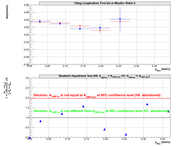
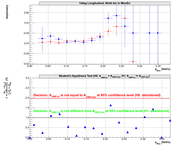
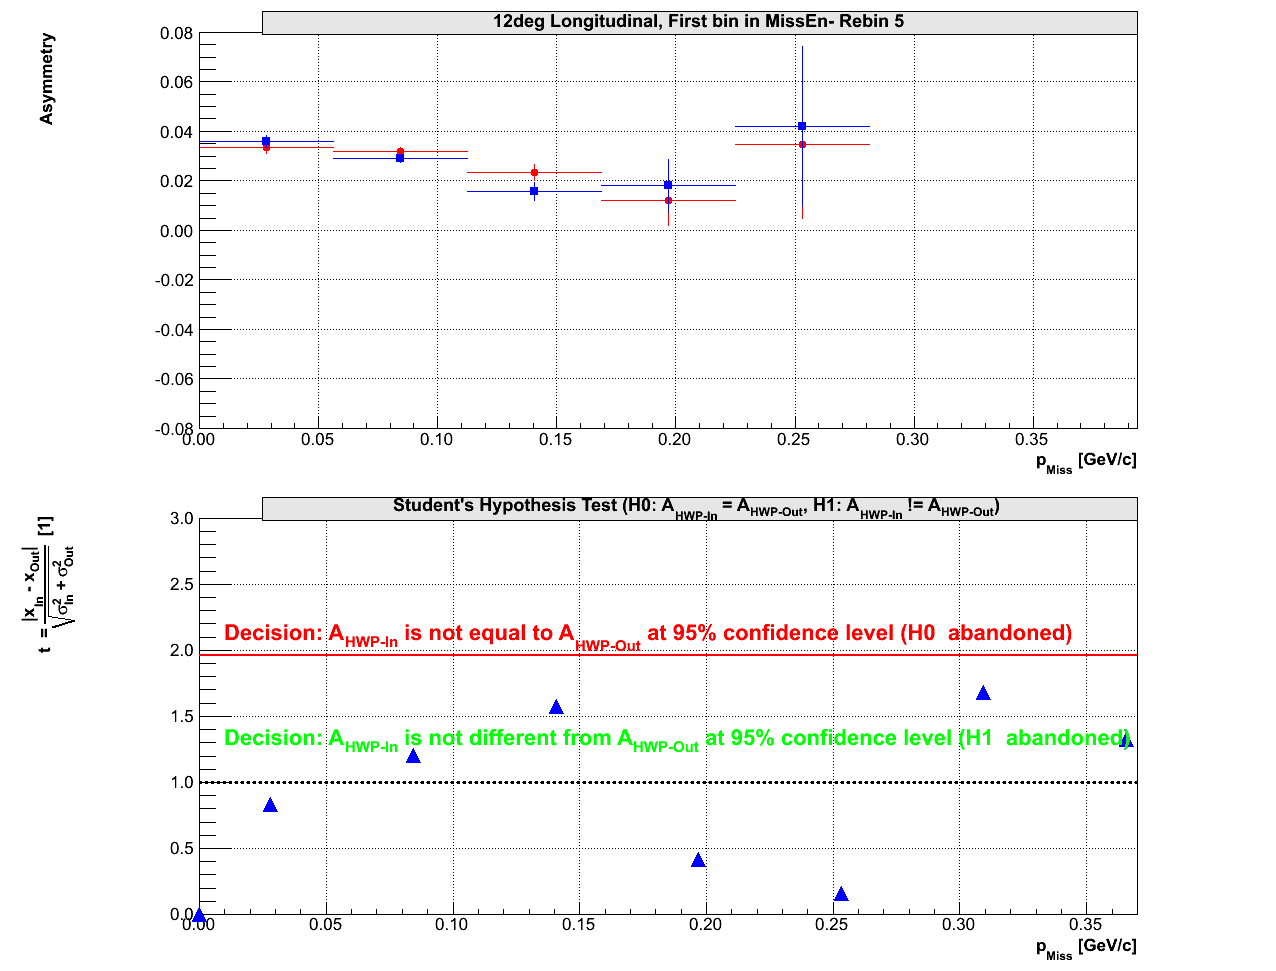
Student tests for 12.5deg RE-BINED data:
Considered larger bin. I increased the re-binning factor from
2 to 5.
17.)
18.) 
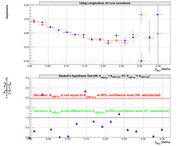
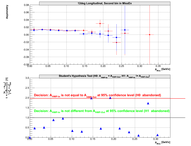
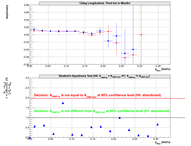
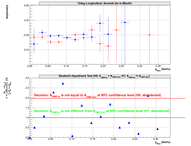
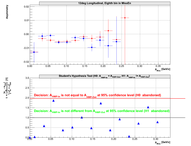
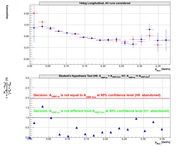
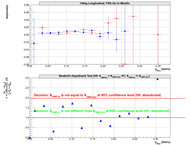
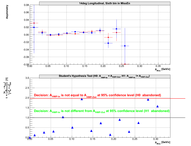
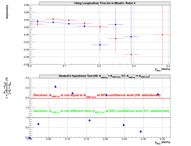
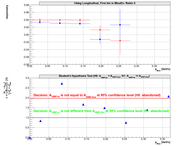
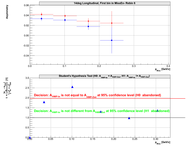
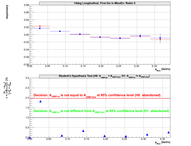
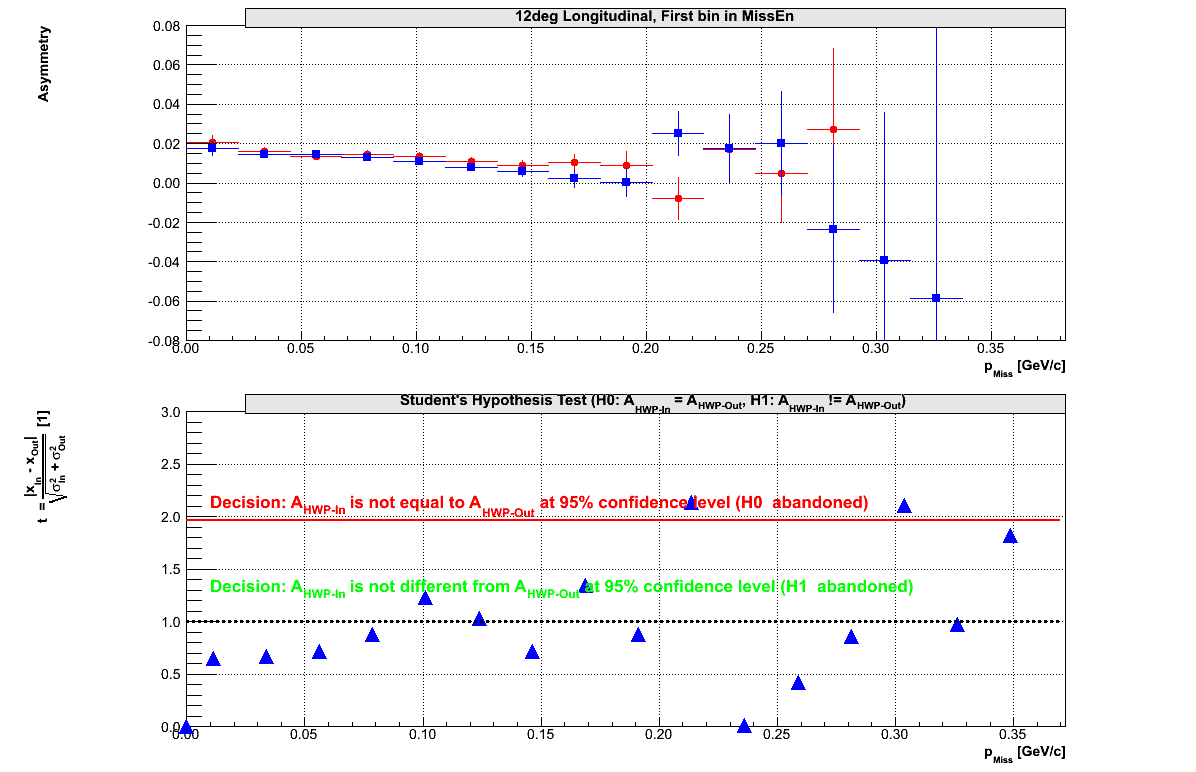
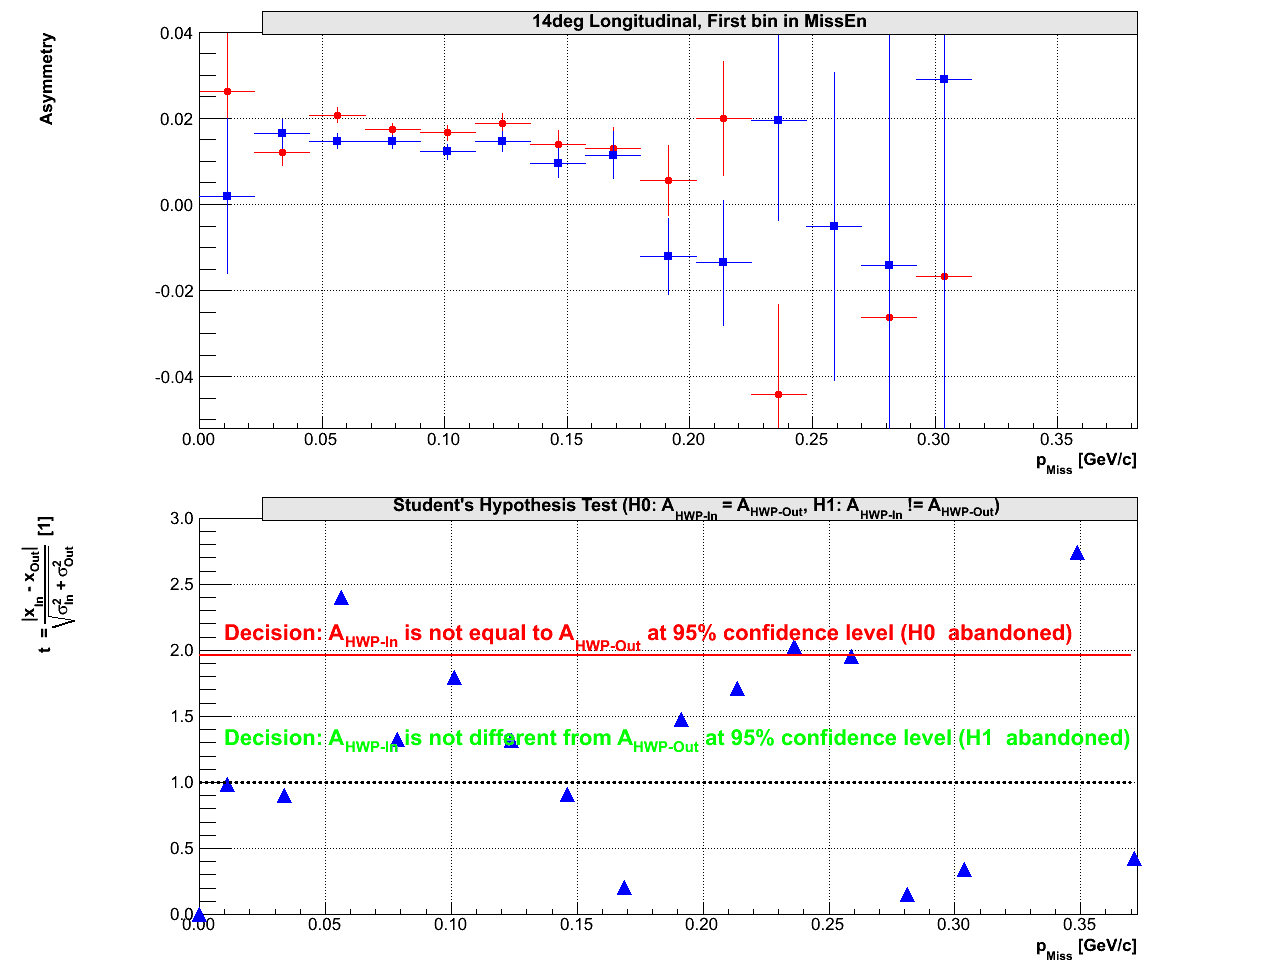
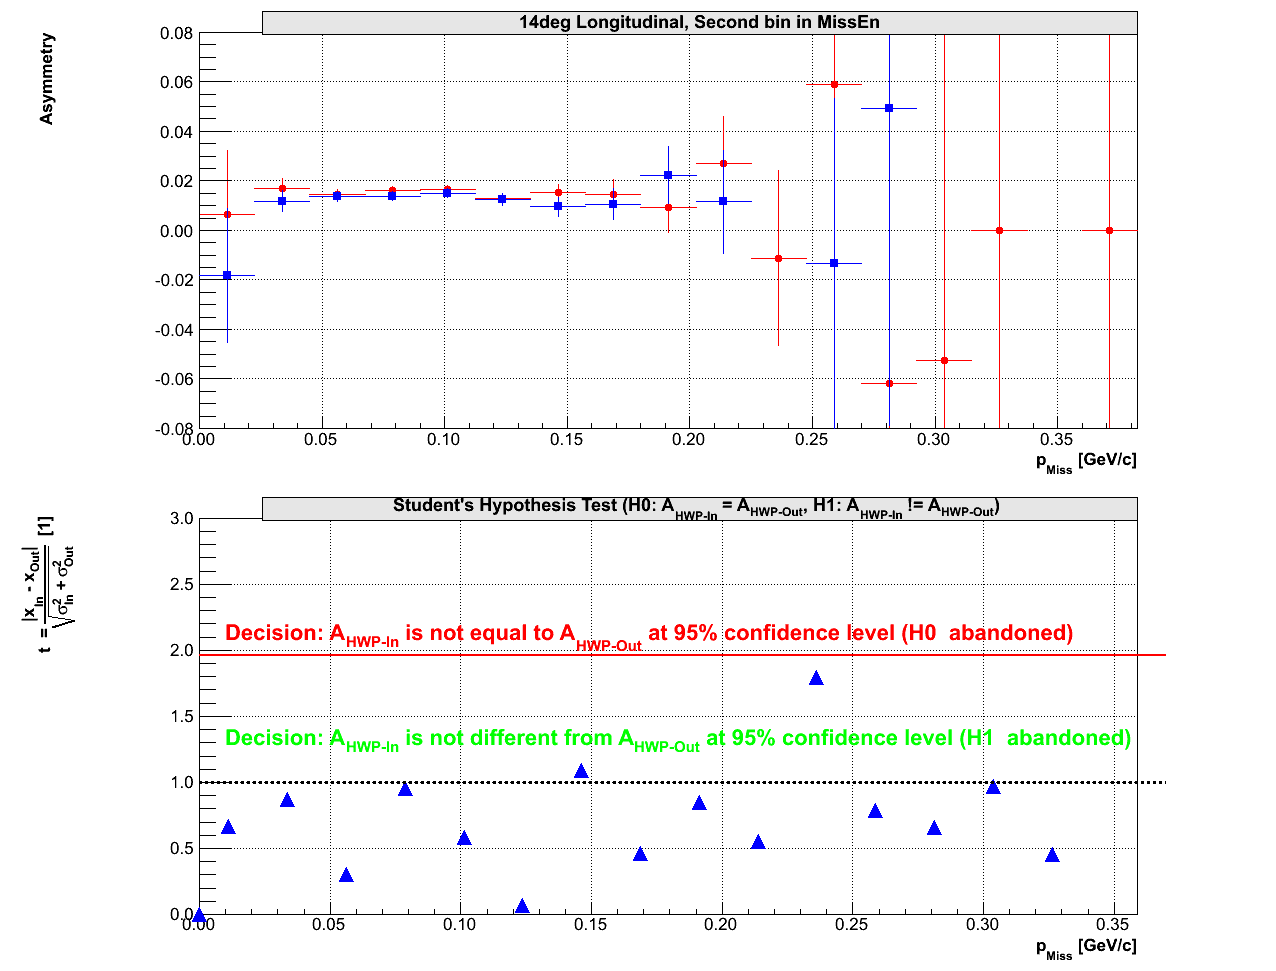
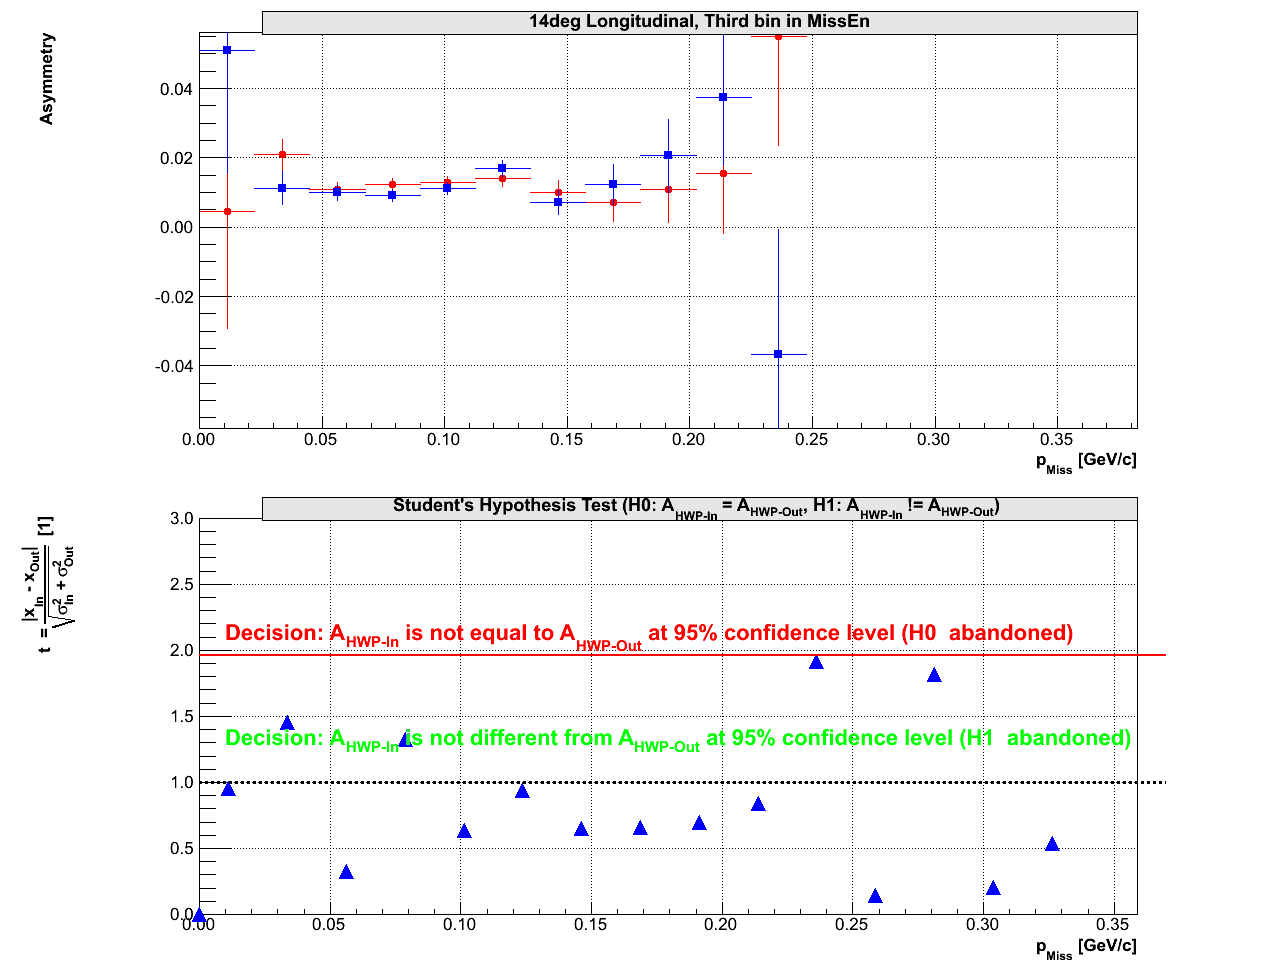
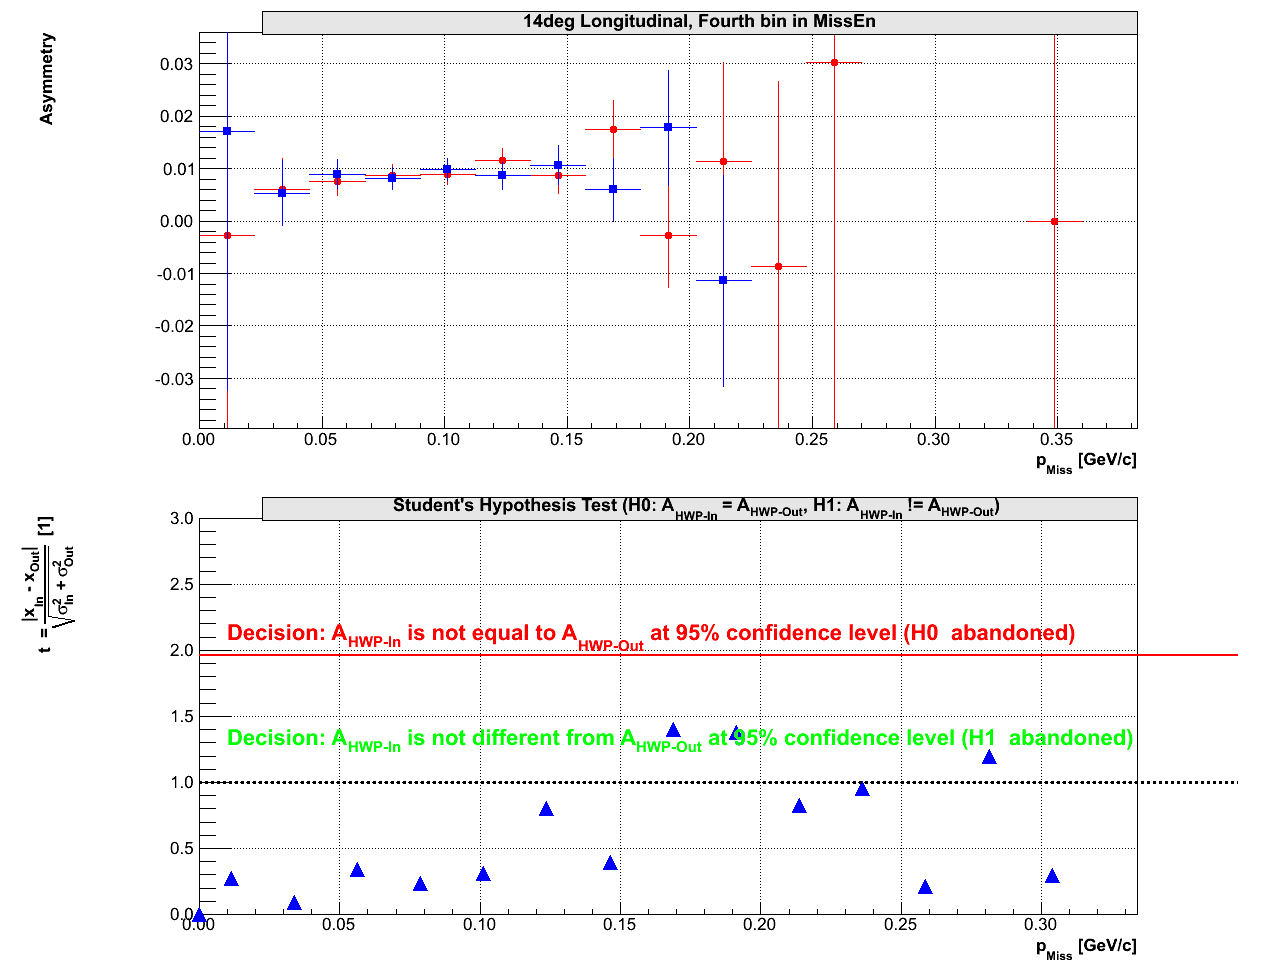
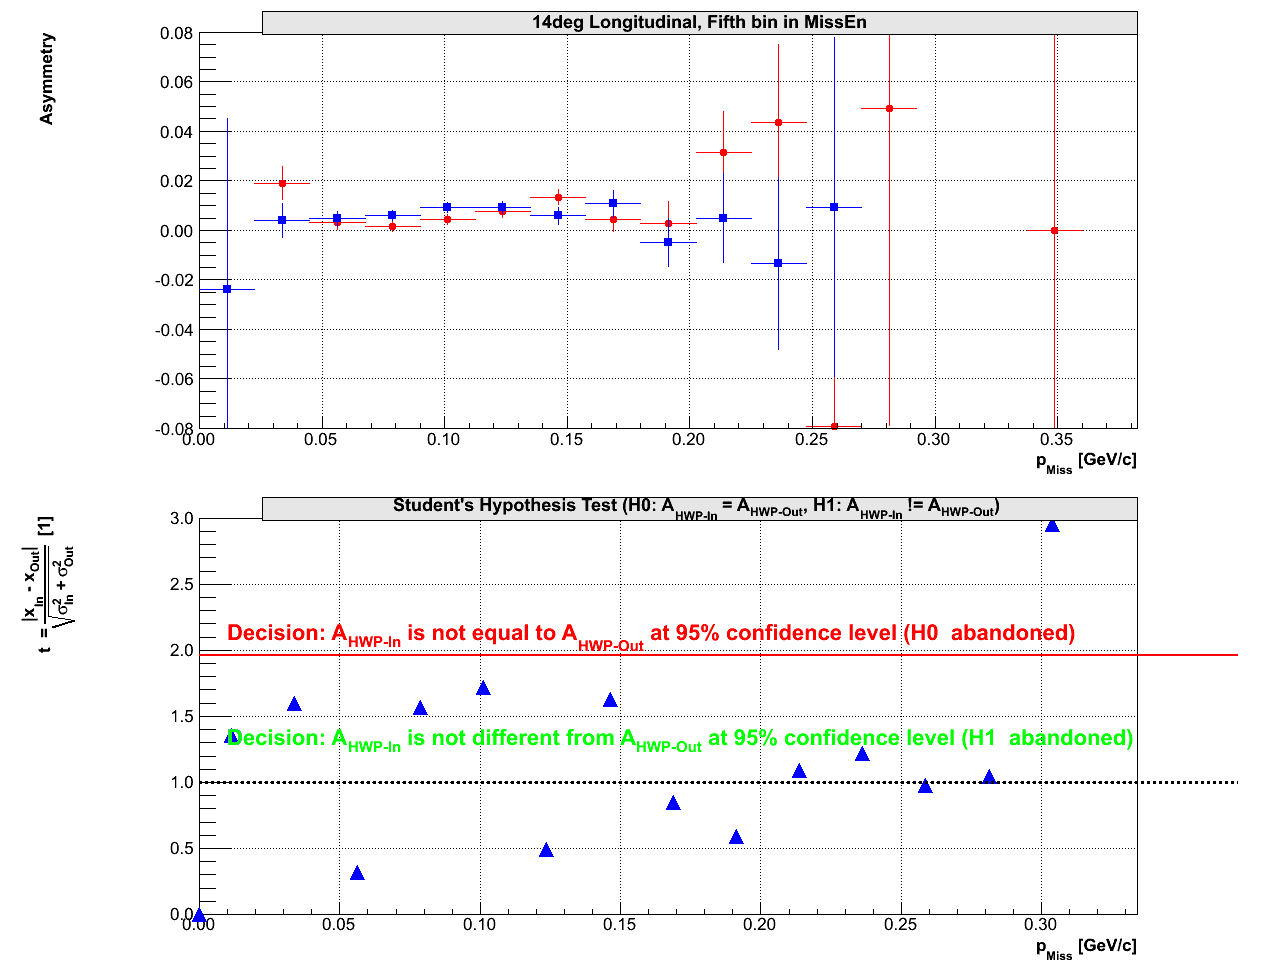
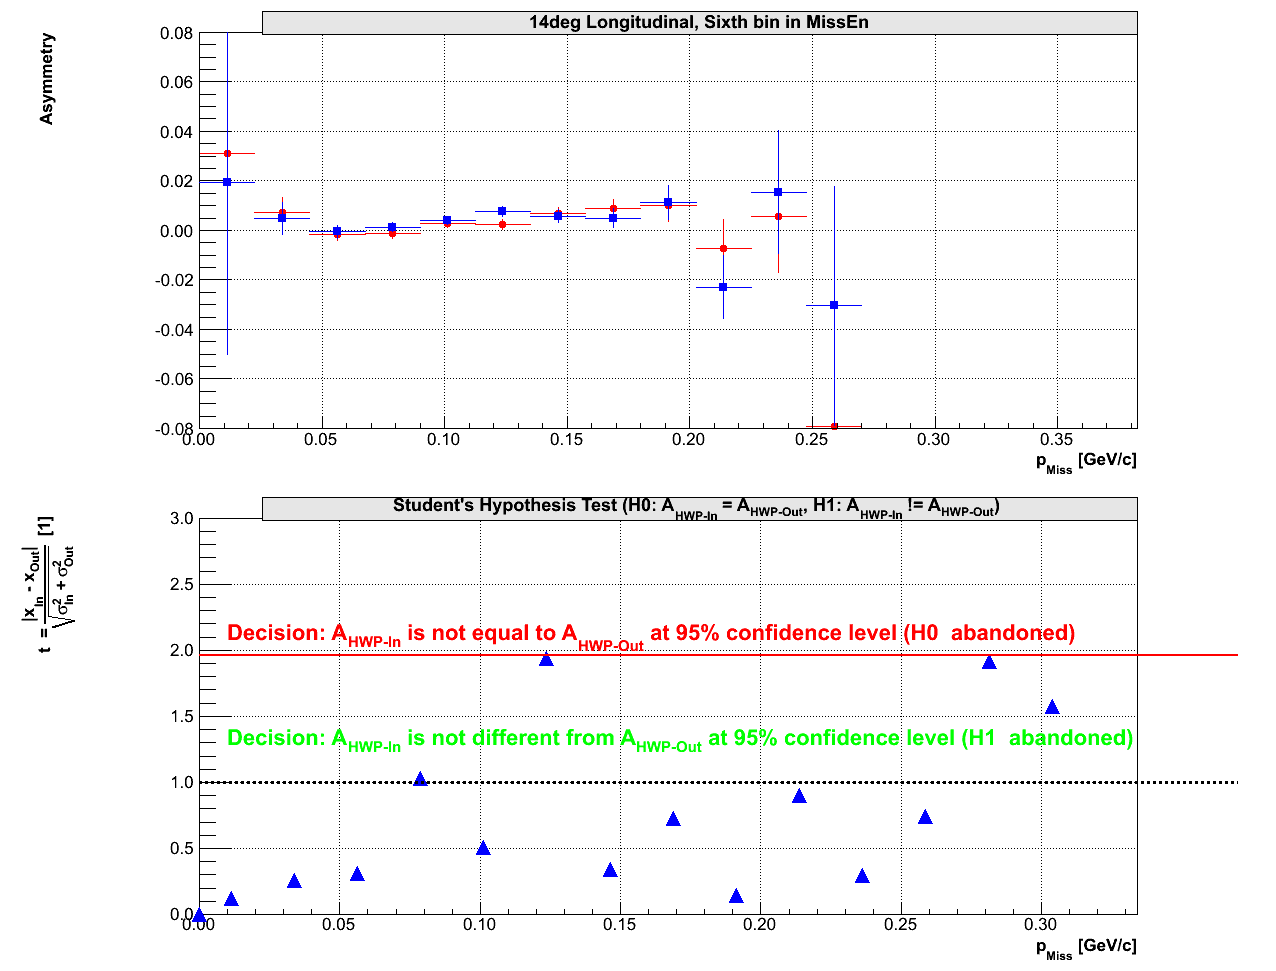
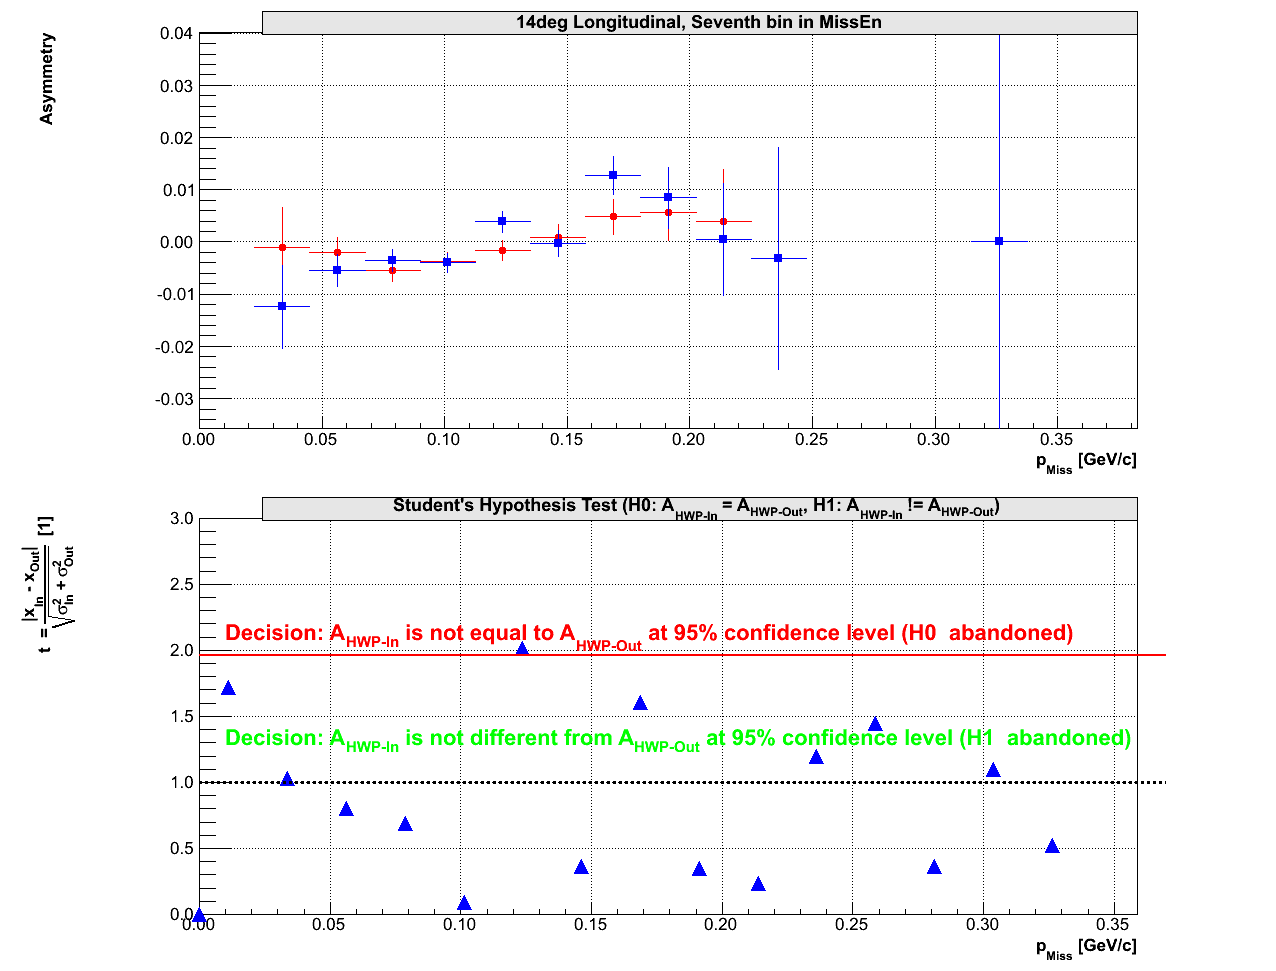
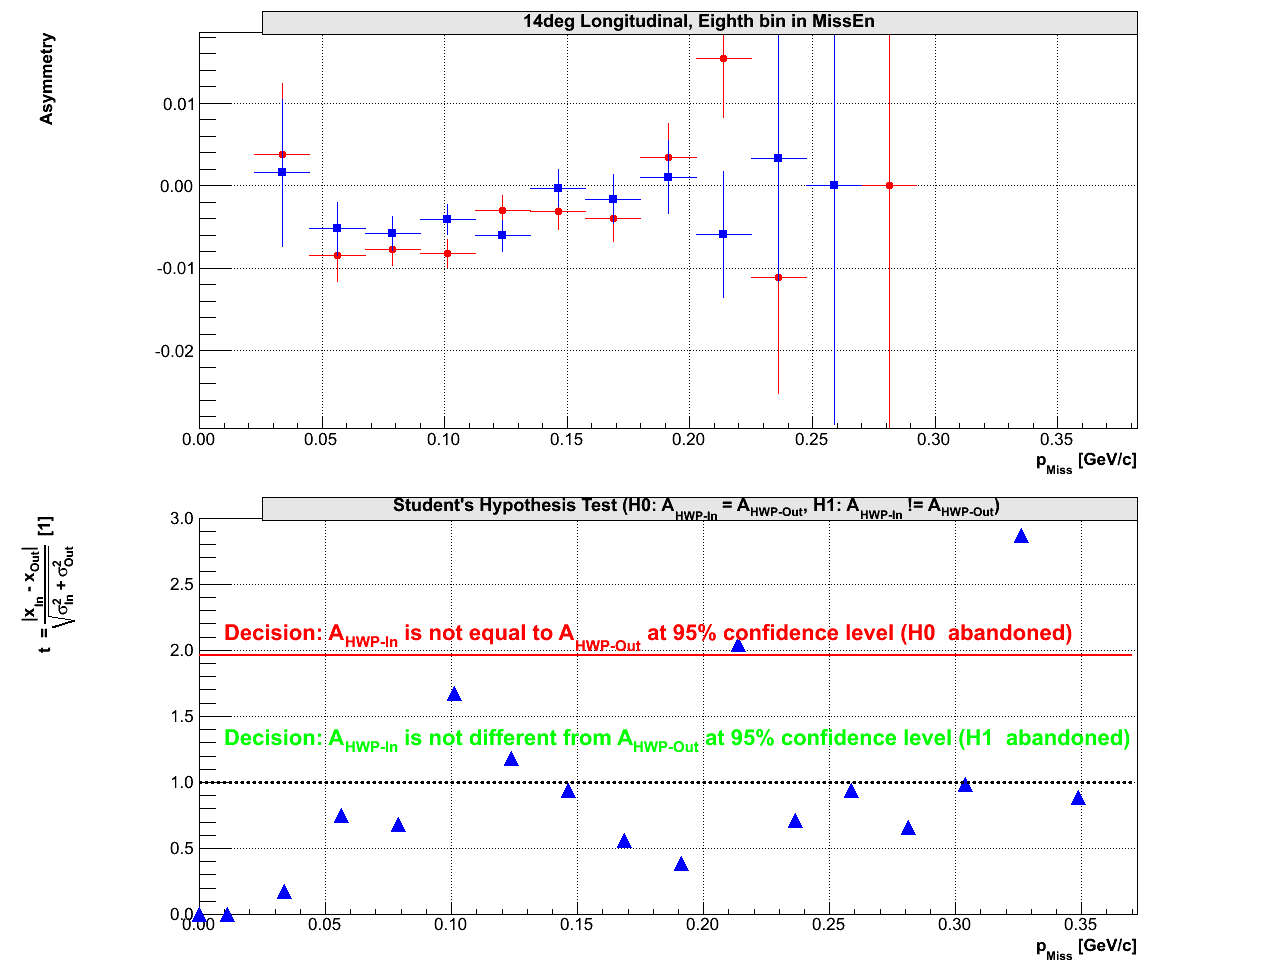
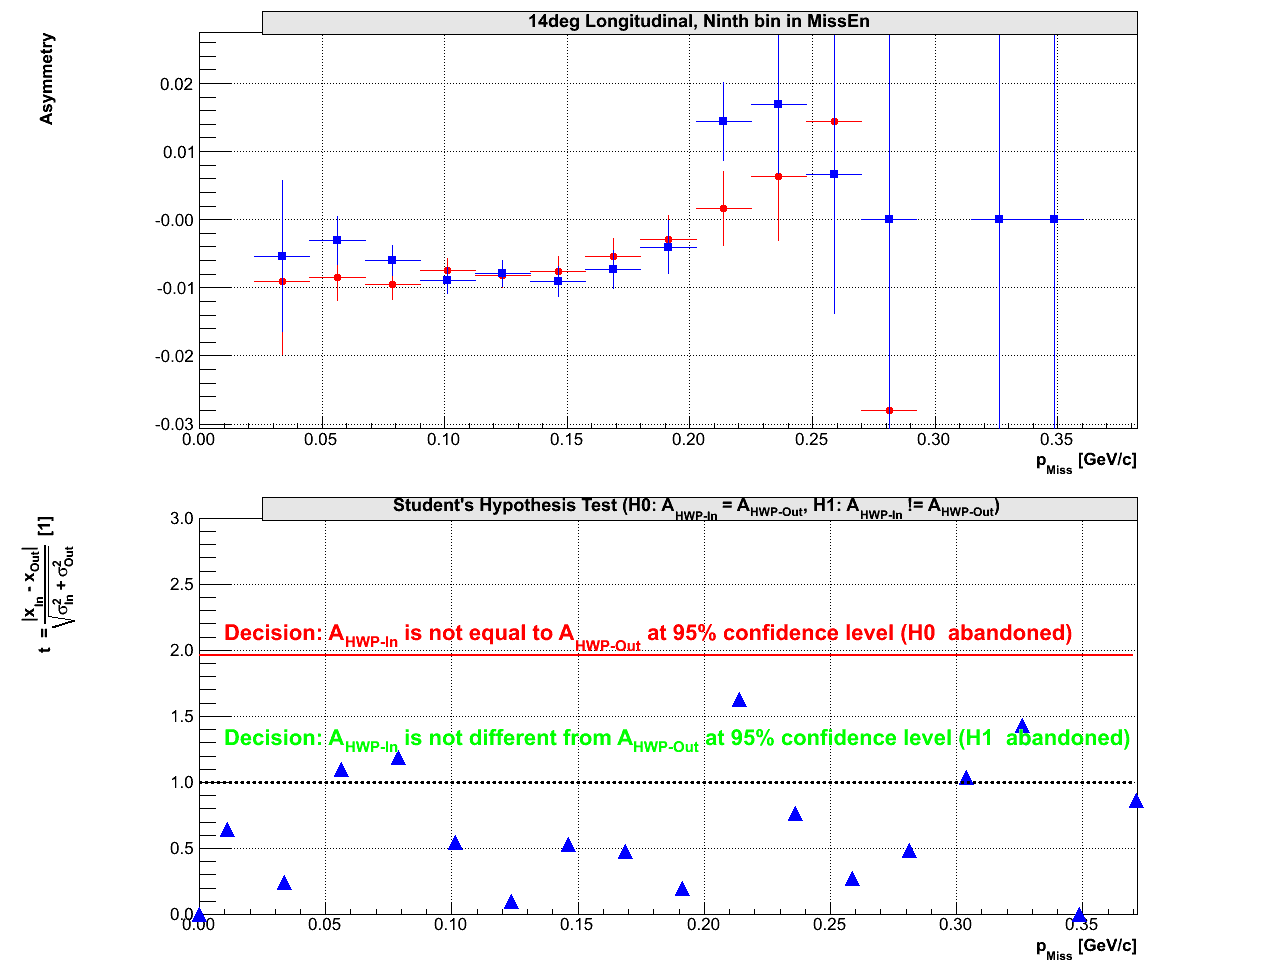
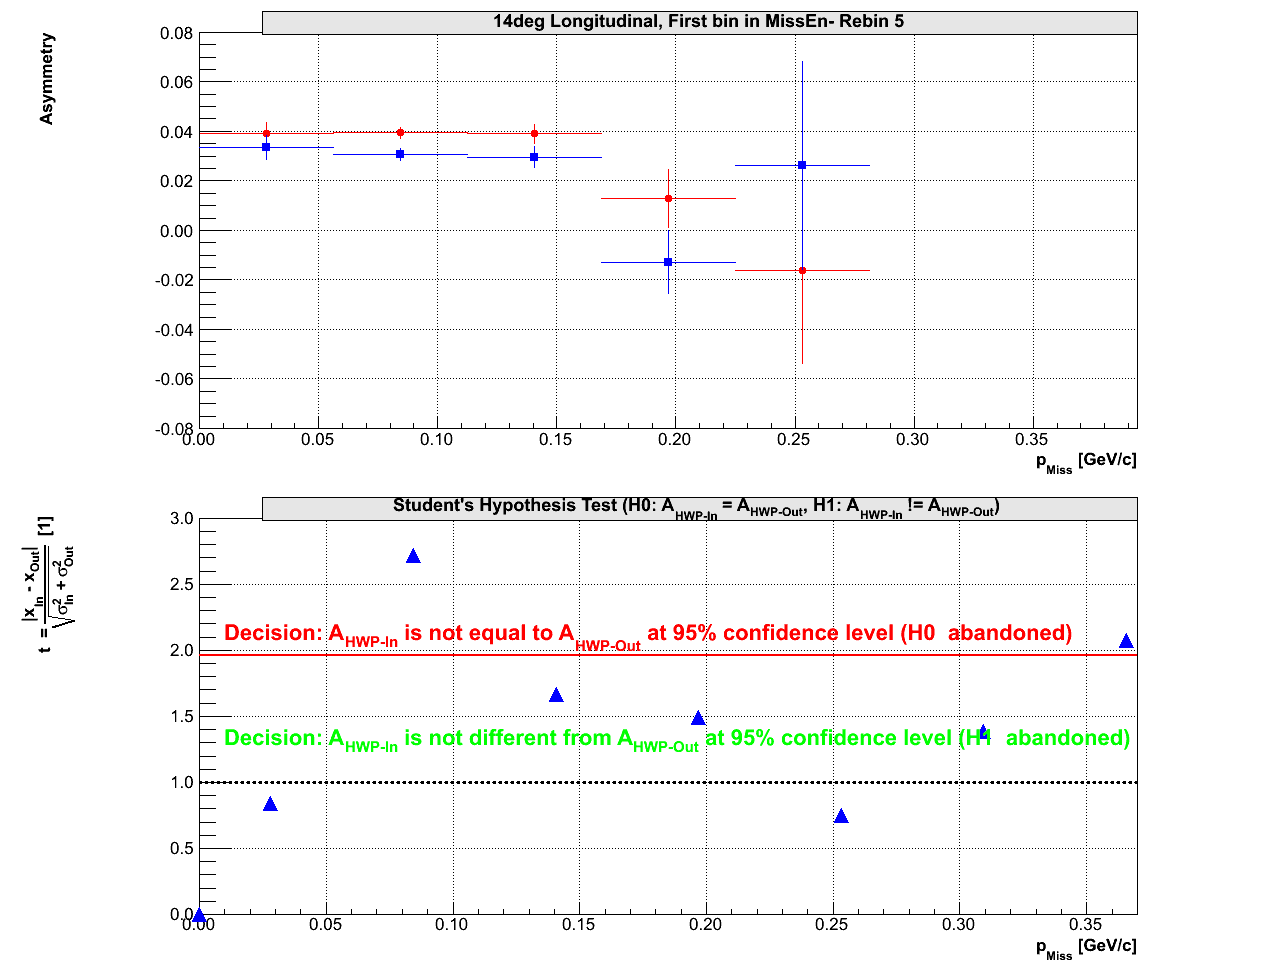
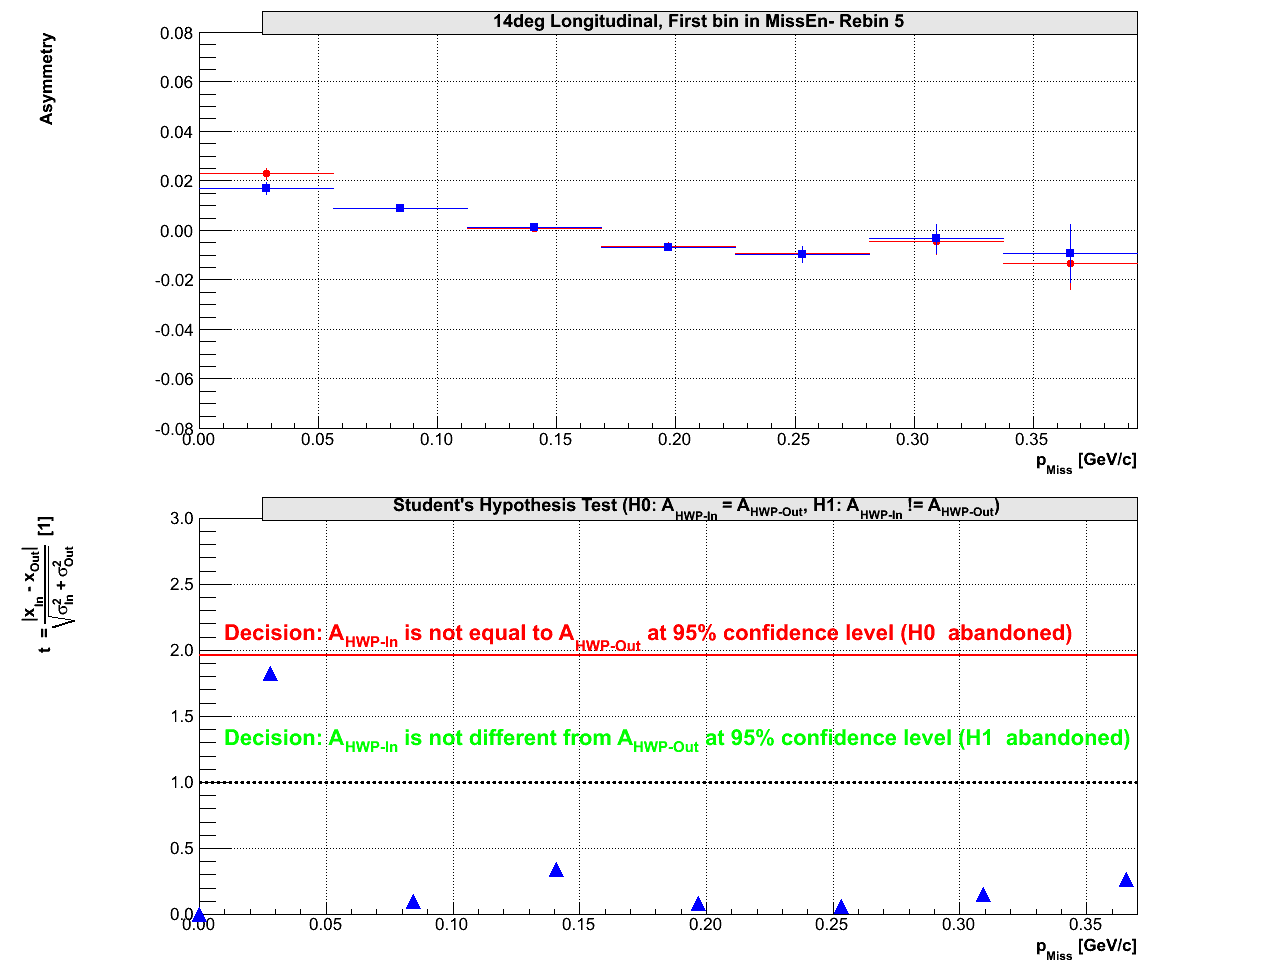
Student tests for 14.5deg data:
The significant difference between HWP-in and HWP-out data
was observed only when looking at the data corresponding to first bin
in the missing energy. The difference is not observed in other plots.
I do not believe that this difference has anything (noticeable) to do
with the HWP change. Other possible reasons could be:
- Background effect (not subtracted yet) in this region with relative low statistics.
- During this period BigBite settings were changing (MWDC settings and E/dE settings).
- ...
So far unable to pinpoint the true reason for this kind of behavior. Checked different
sections of data separately. Did not find noticeable difference. To be continued.
19.)  20.)
20.)  21.)
21.)  22.)
22.) 
23.)  24.)
24.)  25.)
25.)  26.)
26.) 
27.)  28.)
28.) 
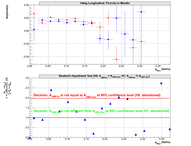
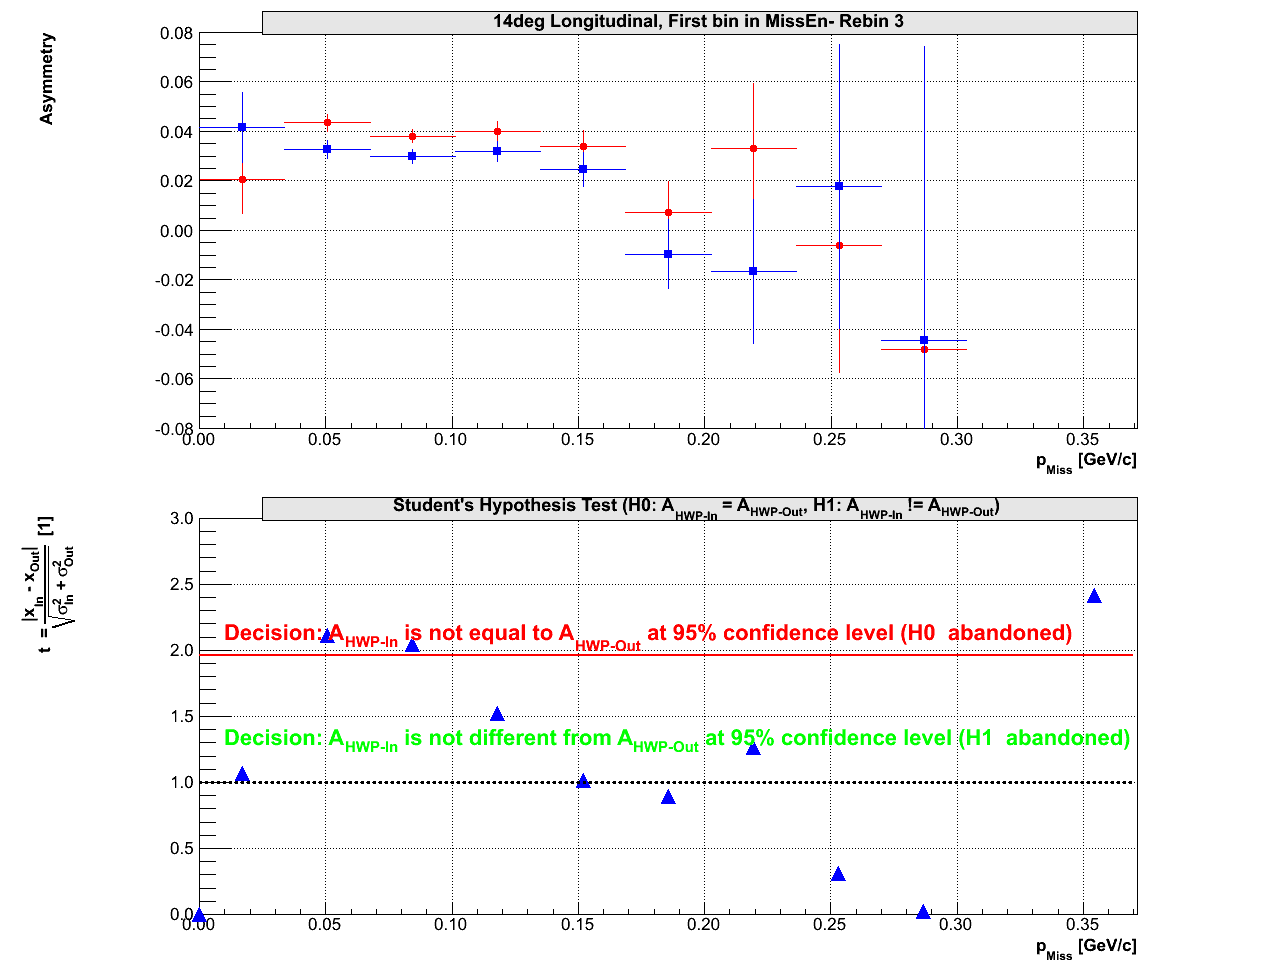
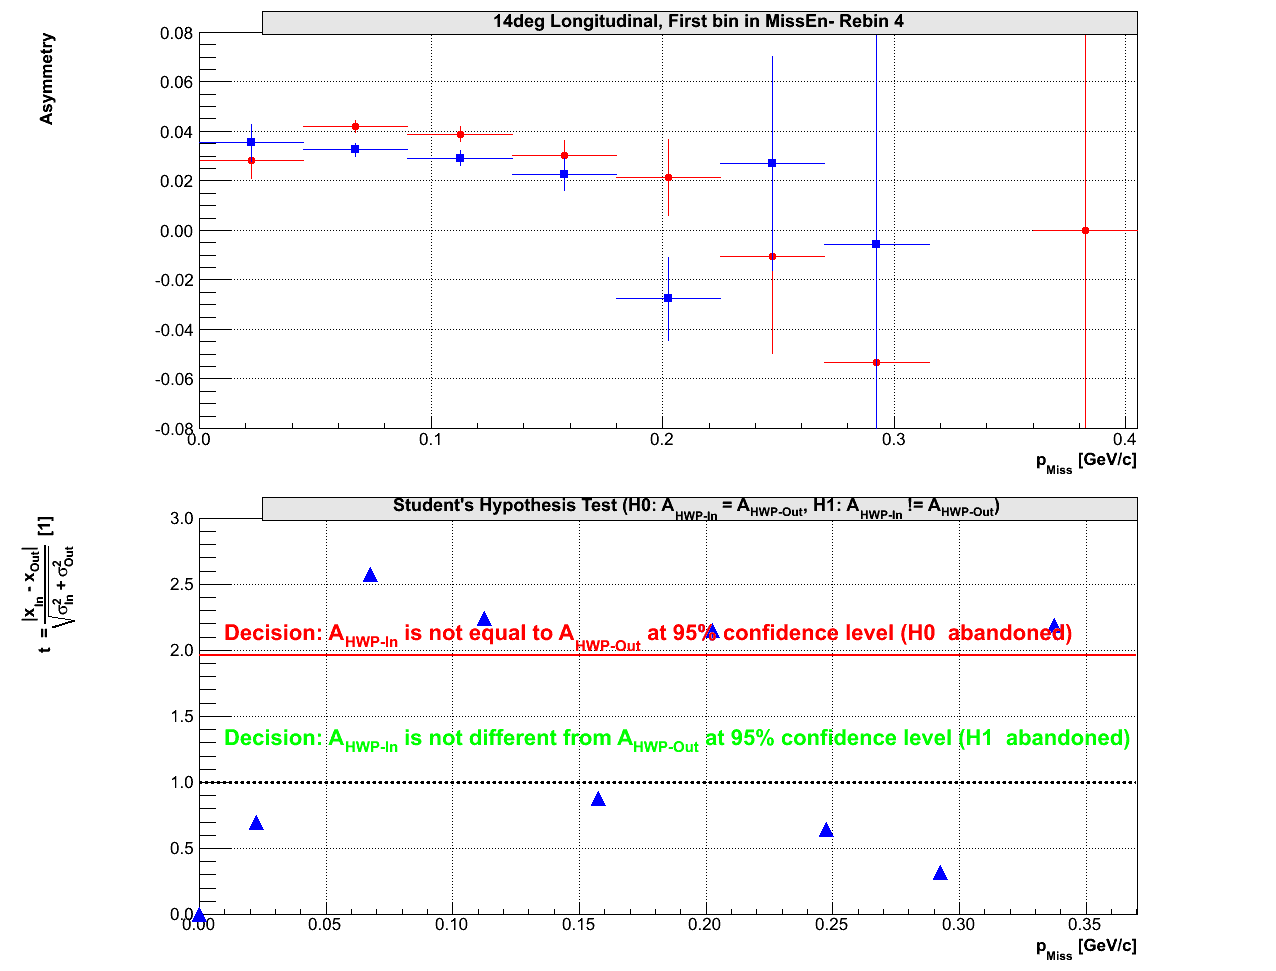
Student tests for 14.5deg REBINED data:
Results for First Missing Energy Bin:
29.)
30.)  31.)
31.)  32.)
32.)  33.)
33.) 
Results for All Missing Energy Bins together:
34.)
35.) 
Cuts on three different sections of Missing Energy:
The sum of all MissEnergy Bins (from -0.05 to 0.081 GeV).
Upper part of data is still missing. Therefore the difference
at high Pmiss
36.) 
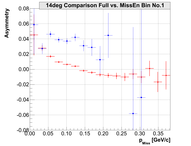
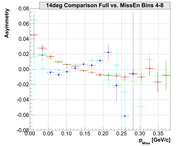
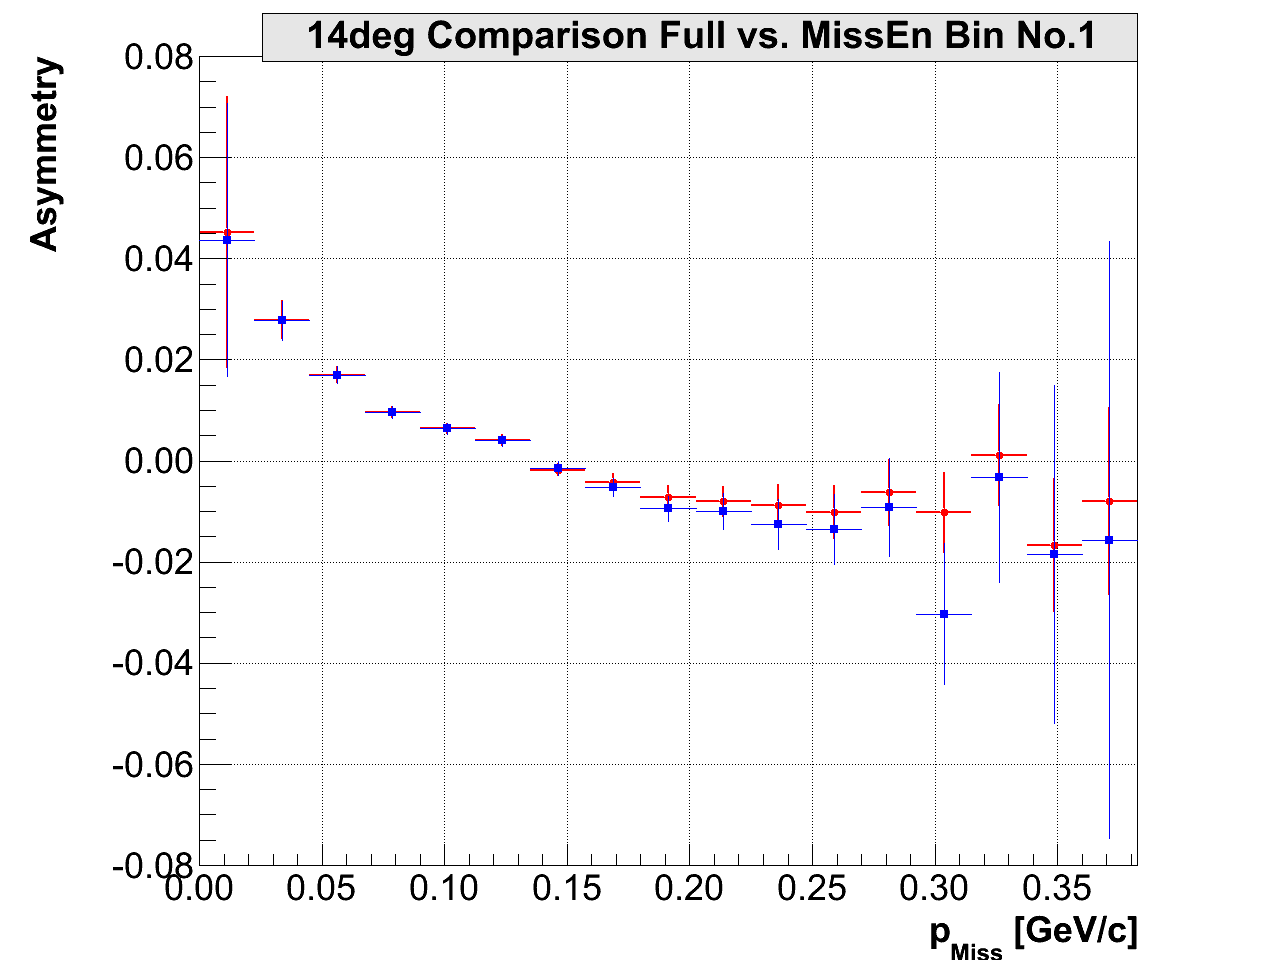
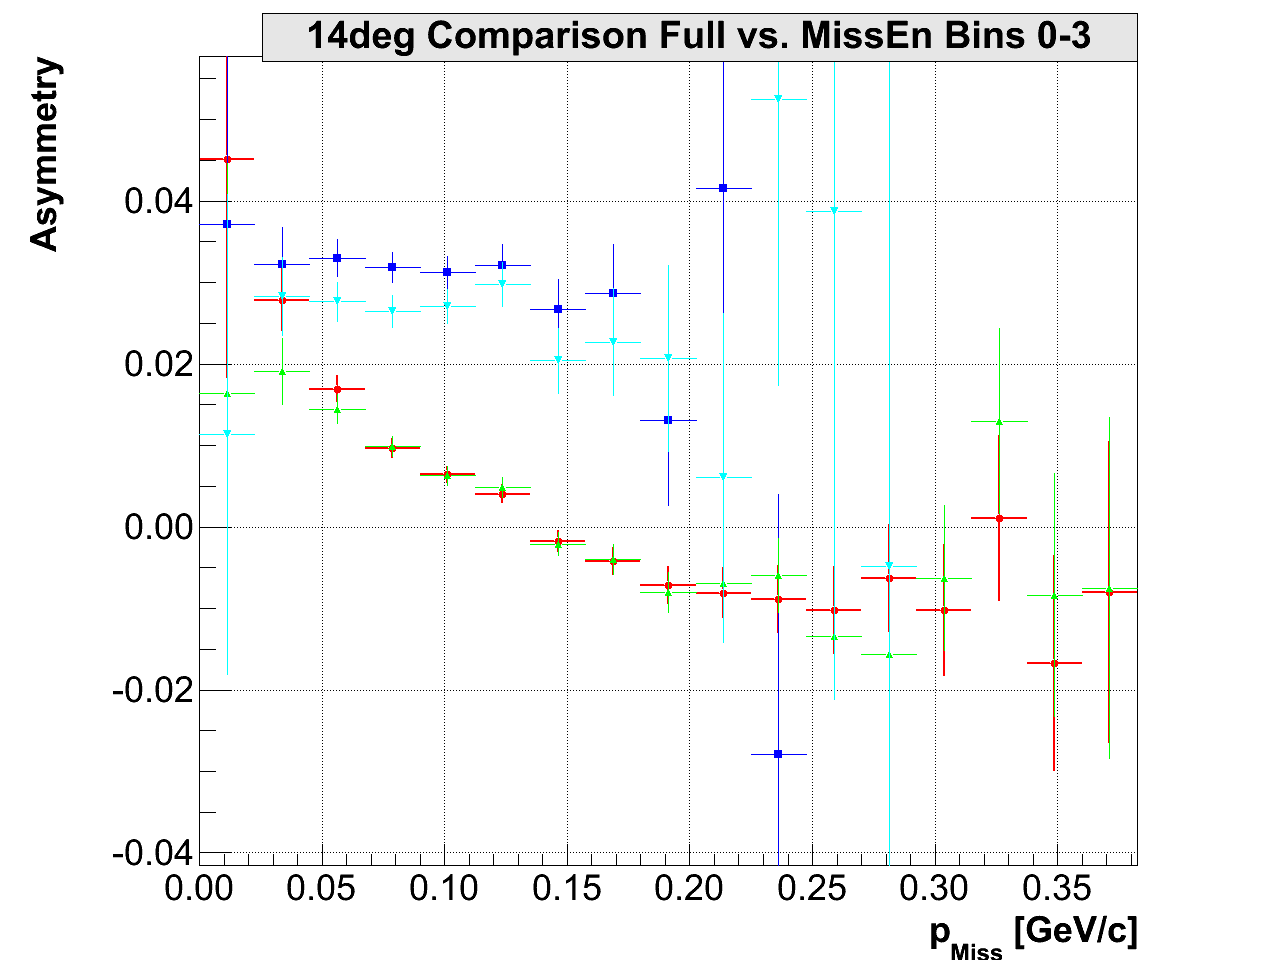
Comparison of the whole set of data with the first bin in Missing Energy
(-0.05, -0.001)GeV:
37.) 
Comparison of the whole set of data with the first four bins Missing Energy
(-0.05, 0.005)GeV:
38.) 
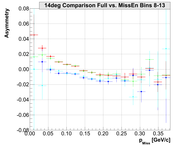
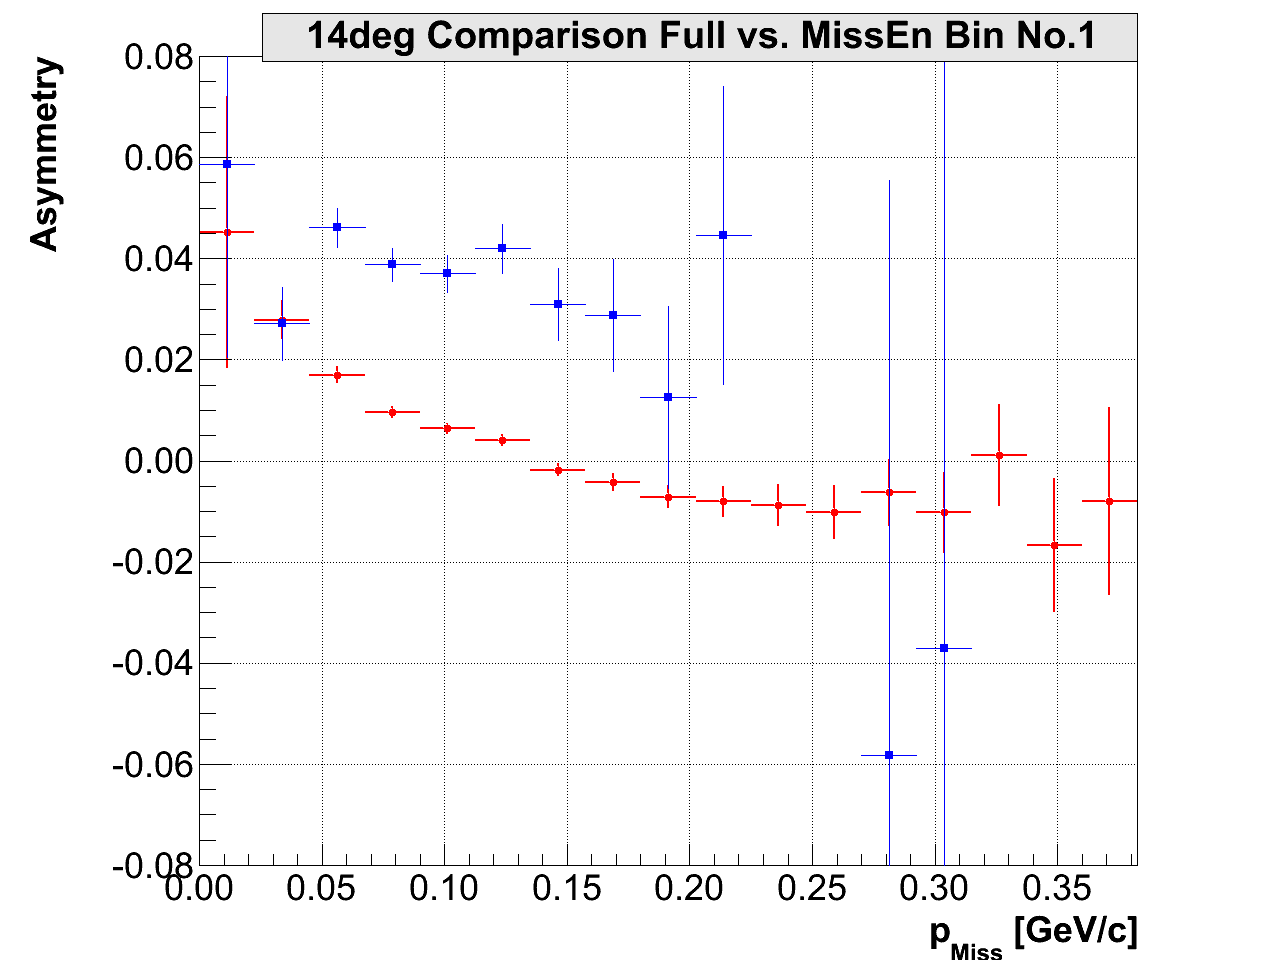
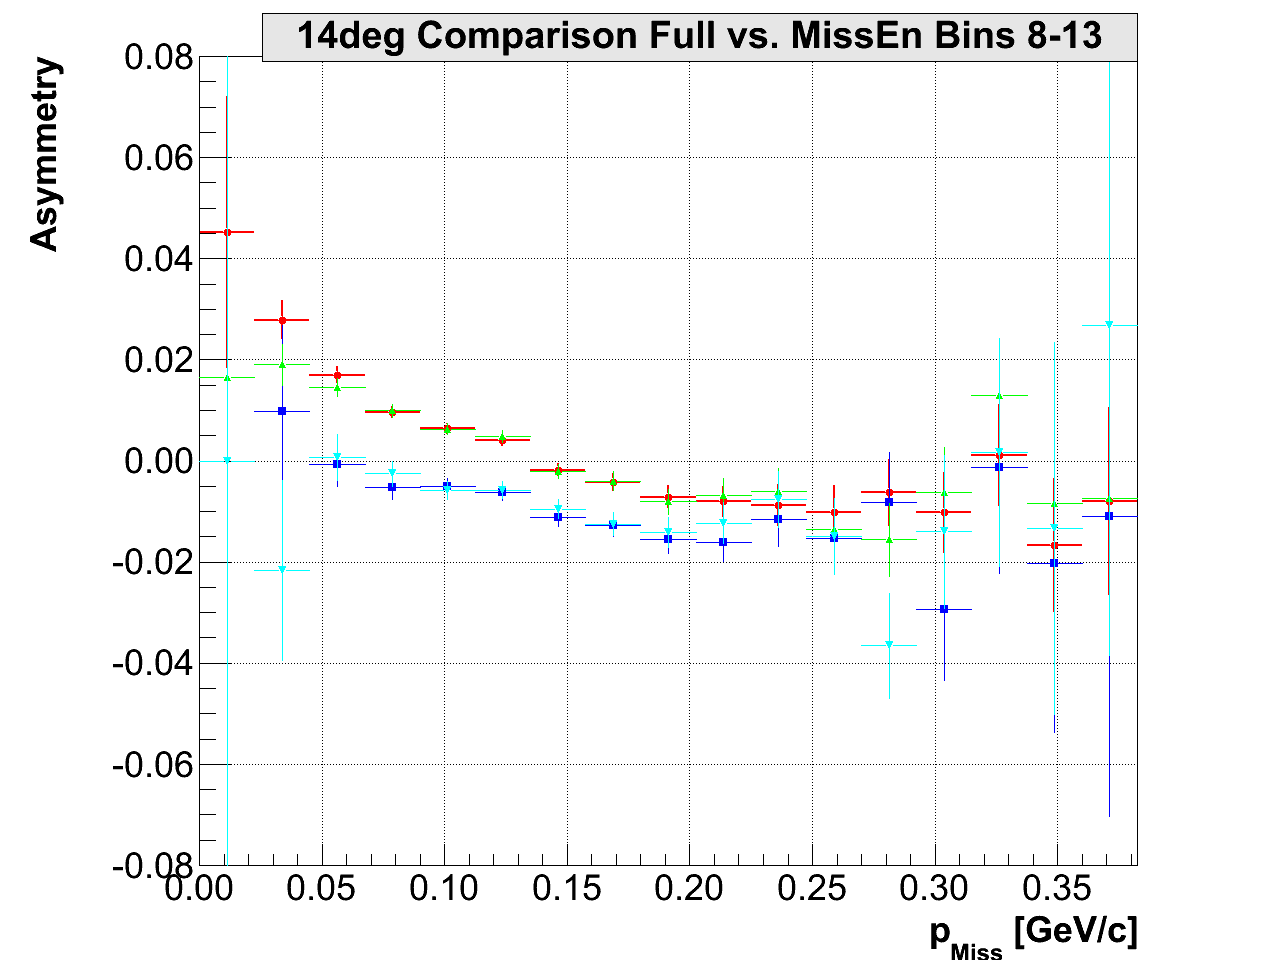
Comparison of the whole set of data with the high Missing Energy data
(0.013, 0.081)GeV:
39.) 
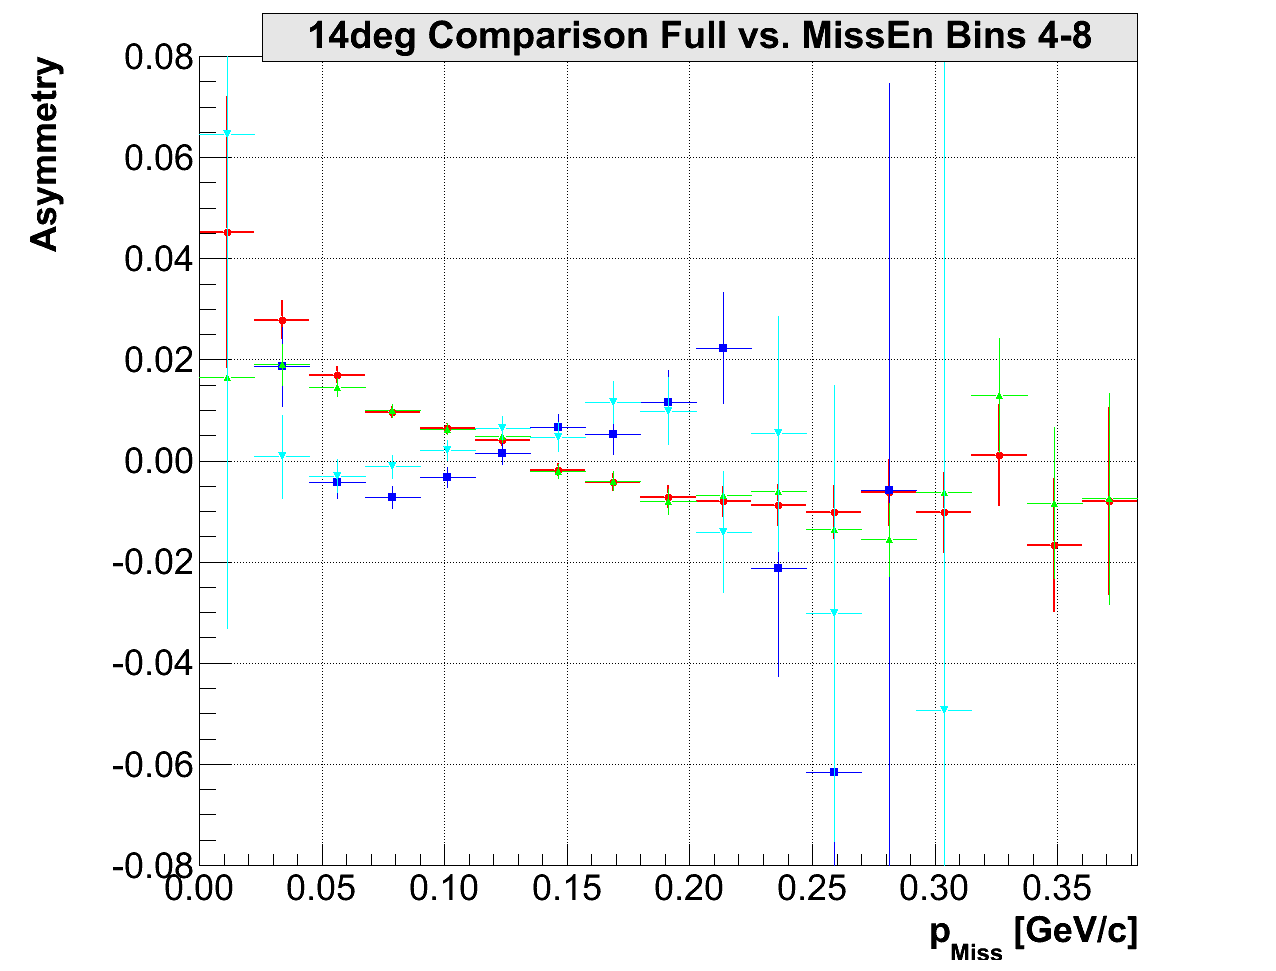
Comparison of the whole set of data with the medium Missing Energy data
(0.005, 0.013)GeV:
40.) 
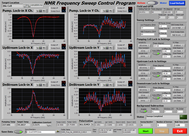
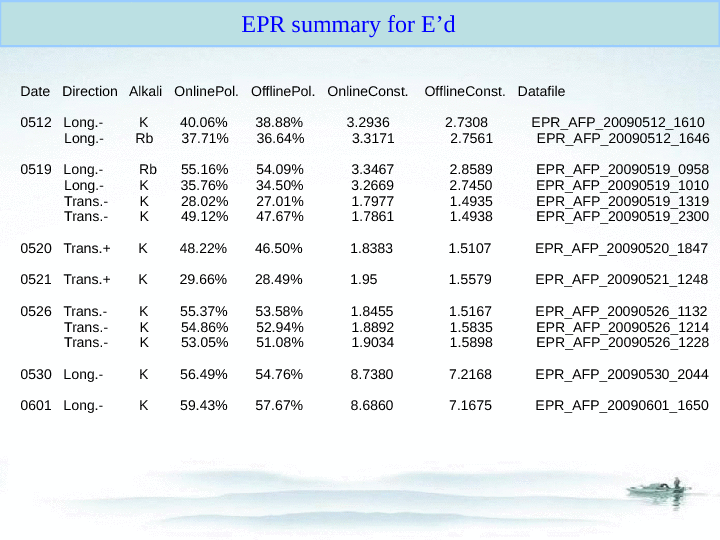
Questions about target polarization:
I am having problems understanding NMR calibration. Therefore I
was bothering Yawei with my questions. My main concern was a
20% difference between online (3.3467) and offline constant (2.8589).
If I would use the offline constant with the online value of the
NMR voltage S_online i.e.
P = C_offline*S_online,
that would change my polarization (asymmetry) for 20% to
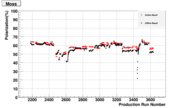
smaller (higher) values. However, since plot below
shows that offline results and the online results for polarization
are very close to each other, I would assume, that
S_online != S_offline.
Am I right? In offline analysis is Yawei probably interpreting the NMR signals
differently??
41.)  42.)
42.)  43.)
43.) 
Last modified: 02/08/12
 03.)
03.)  04.)
04.) 
 06.)
06.) 
 08.)
08.)  09.)
09.)  10.)
10.) 
 12.)
12.)  13.)
13.)  14.)
14.) 
 16.)
16.) 
 20.)
20.)  21.)
21.)  22.)
22.) 
 24.)
24.)  25.)
25.)  26.)
26.) 
 28.)
28.) 
 31.)
31.)  32.)
32.)  33.)
33.) 
 42.)
42.)  43.)
43.) 