Phone Meeting: The Carbon runs etc. (01/23/2009)
Charge and Current data of carbon data.
In order to determine the cross-section for the Carbon elastic runs I first need to determine the accumulated charge in each run:
The list of runs that I plan to use in my G0 analysis: Carbon_BCM.dat.
The columns in thetable represent the following quantities: Run #, BCMu1, BCMu3, BCMu10,
BCMd1, BCMd3 and BCMd10.
Graph below shows, which runs have problems with the sign of charge and current.
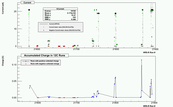
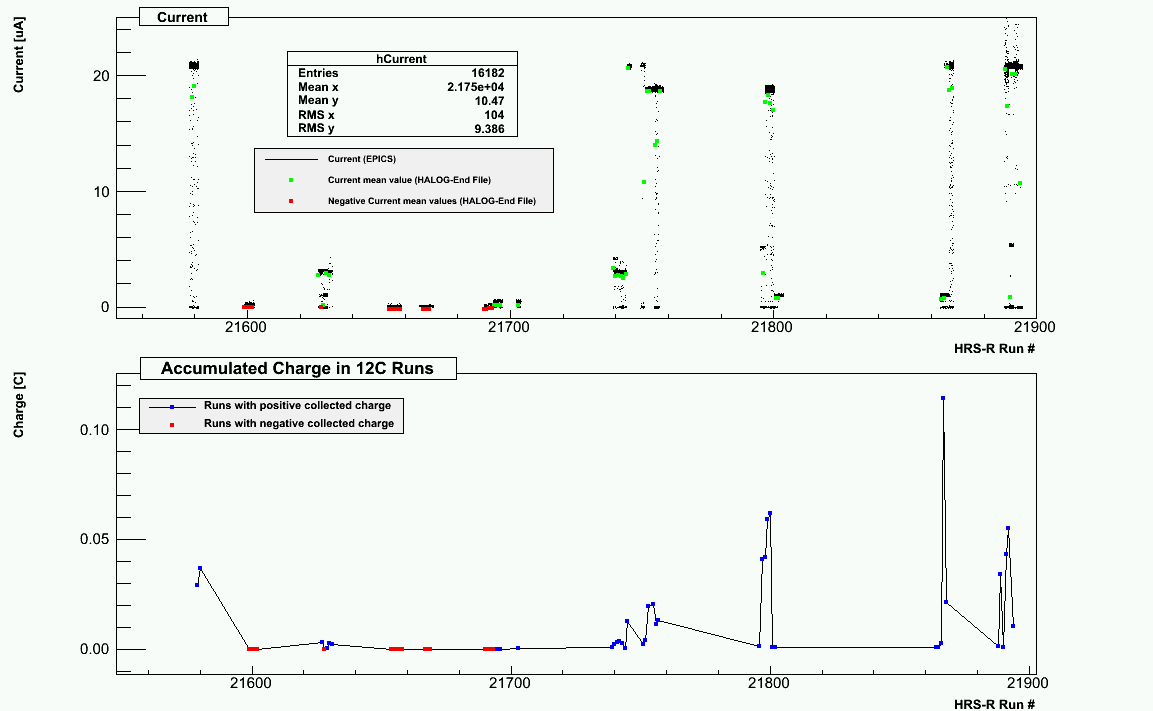
Please see figure "Carbon_Current_And_Charge.png". First graph shows the current
in each run. The black dots represent the distribution of actual current readouts
(EPICS - hac_bcm_average). Each run contains approx. 200 EPICS readouts. The green
squares represent the BCMx1 average current, read from the End-of-run Halog file. The red
squares on the other hand represent those runs, that have negative current (or negative charge)
The second graph in figure "Carbon_Current_And_Charge.png" shows the collected charge
for each run.
1.) 
Examples of an End-of-run HALOG entries that have positive charge (average current):
http://www.jlab.org/~adaq/halog/html/0608_archive/060828193444.html.
http://www.jlab.org/~adaq/halog/html/0608_archive/060830040125.html.
Examples of an End-of-run HALOG entries that have negative charge (average current):
http://www.jlab.org/~adaq/halog/html/0608_archive/060827003422.html.
http://www.jlab.org/~adaq/halog/html/0608_archive/060827003056.html.
If I multiply the average current with the length of the run (seconds) for any of these runs
I get approximately correct value of the accumulated charge - also the sign of the charge.
Tiefenbach Energy:
I have also started collecting the Tiefenbach data for all the runs. Simon and I have written some
shell script in order to extract Tiefenbach data from all available runs. We are using "grep"
command to read data directly from raw data files. This procedure works faster than anything
else (i.e. root analysis) but it still takes quite some time.
getTiefenbach.sh.
getcurrents.sh.
We have started our analysis on the adaq6
because there are approx. 500 runs available there for the analysis. In my local computer I have
only approx. 150 runs. I am sending you some "preliminary " results of the
analysis.
2.)  3.)
3.) 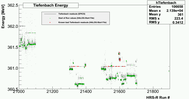
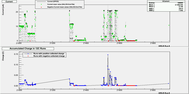
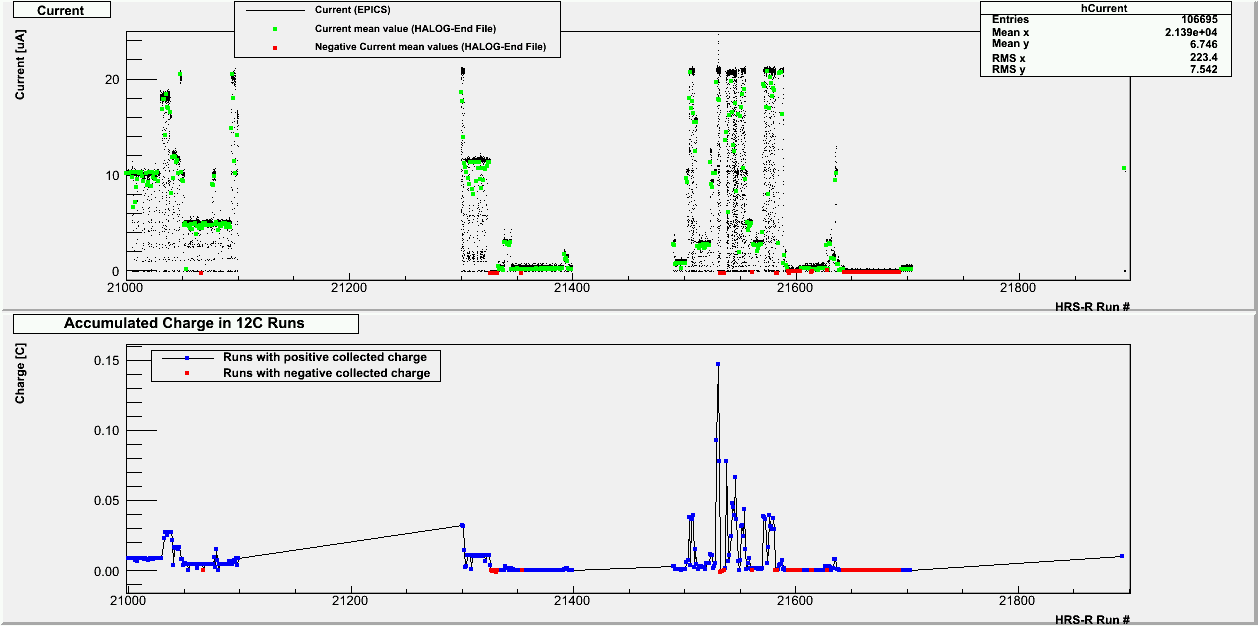
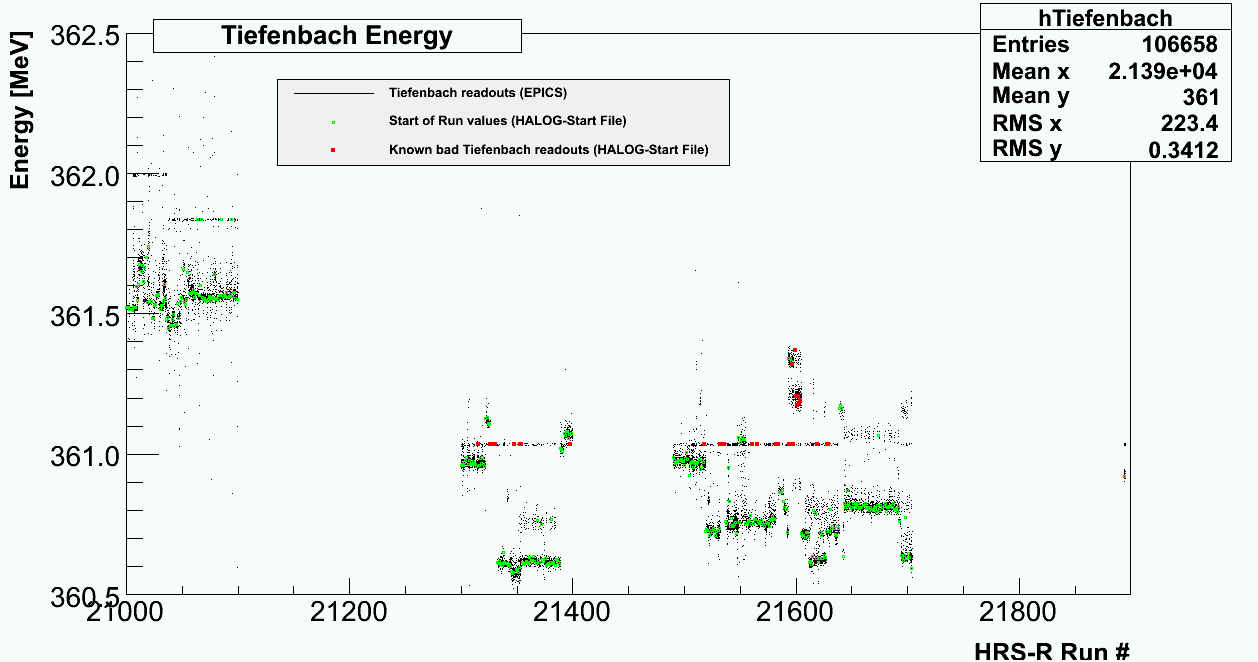
The first figure shows the same things as "Carbon_Current_And_Charge.png" but includes all runs, not only Carbon ones. The "Tiefenbach.png", however, shows the Tiefenbach energies for every run. Again, the black dots are actual readouts for every run. The green circles are Tiefenbach values from the beginning of each run, while the red squares mark the region where we know, that Tiefenbach doesn't work correctly ( i.e. runs with oscillating Tiefenbach values or runs where Tiefenbach wasn't working at all and gave out the fixed reading 361.033MeV.)
If you agree I would load the rest of the HRS-R runs (approx. 500 left) from the Silo to the same directory at JLab
(using the jcache command) and than run my analysis on the whole set of data?
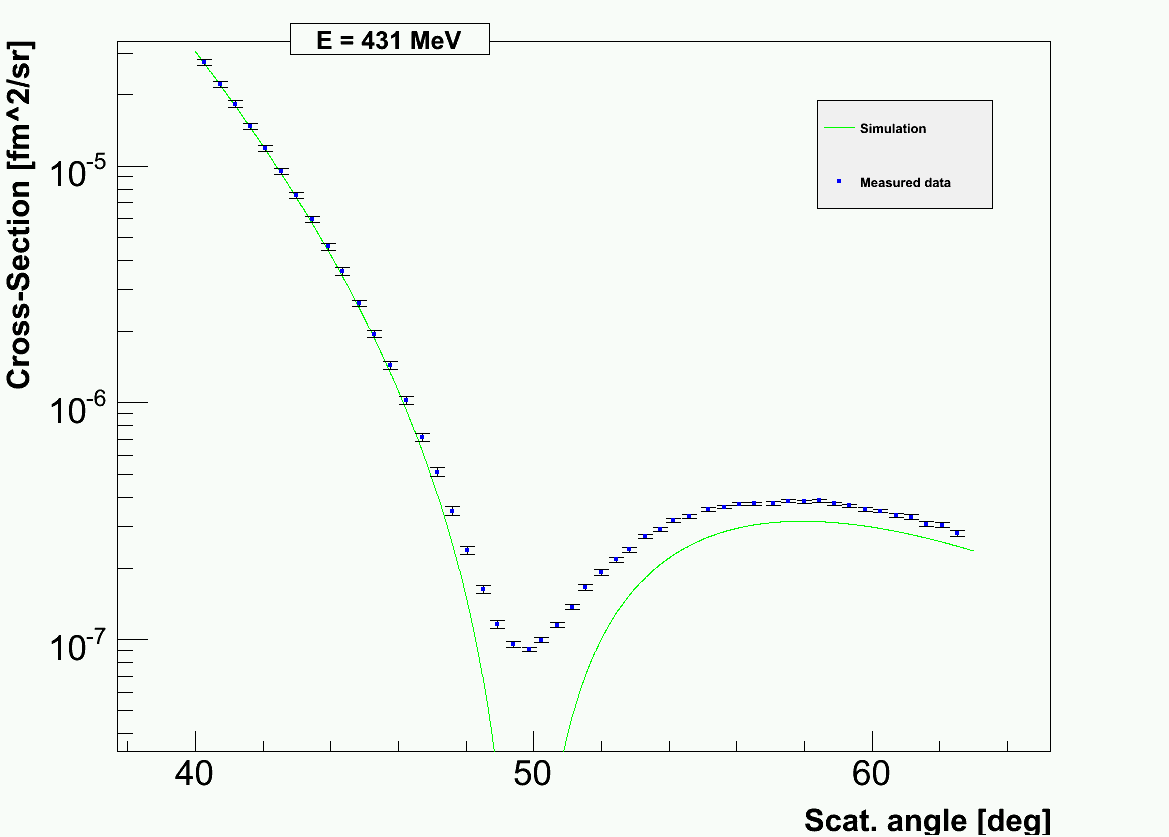
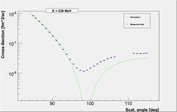
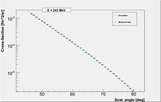
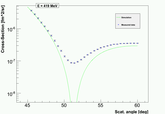
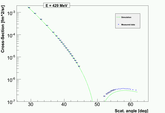
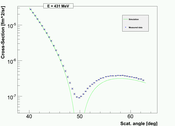
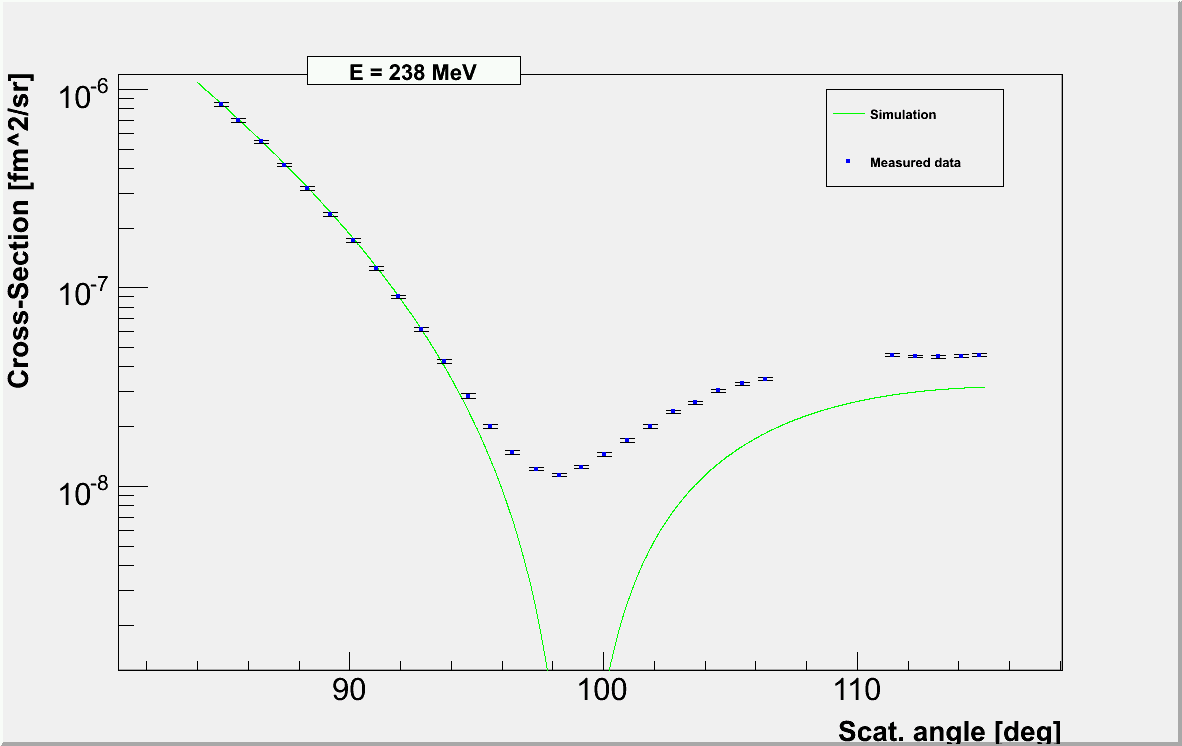
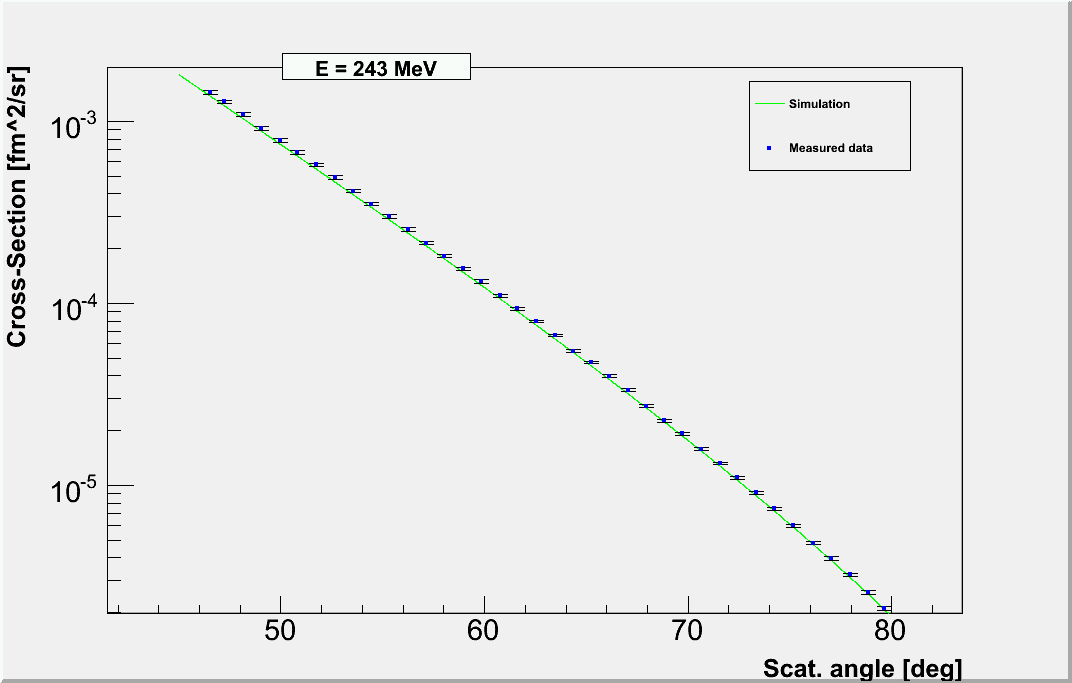
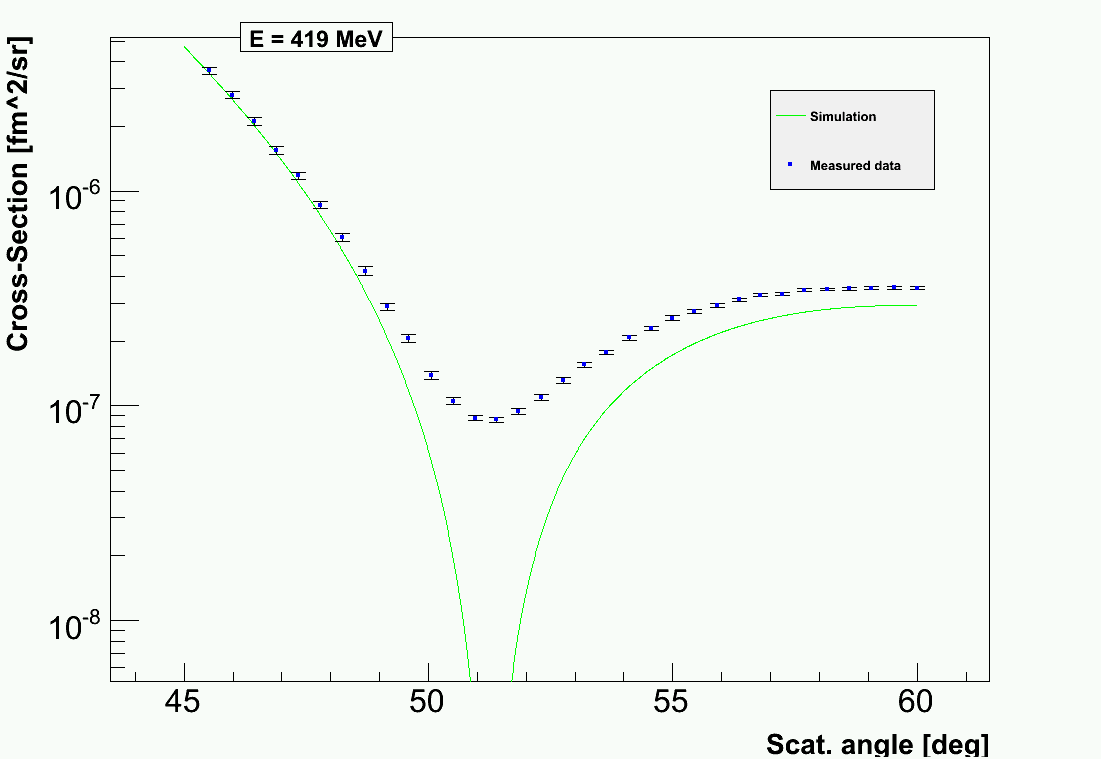
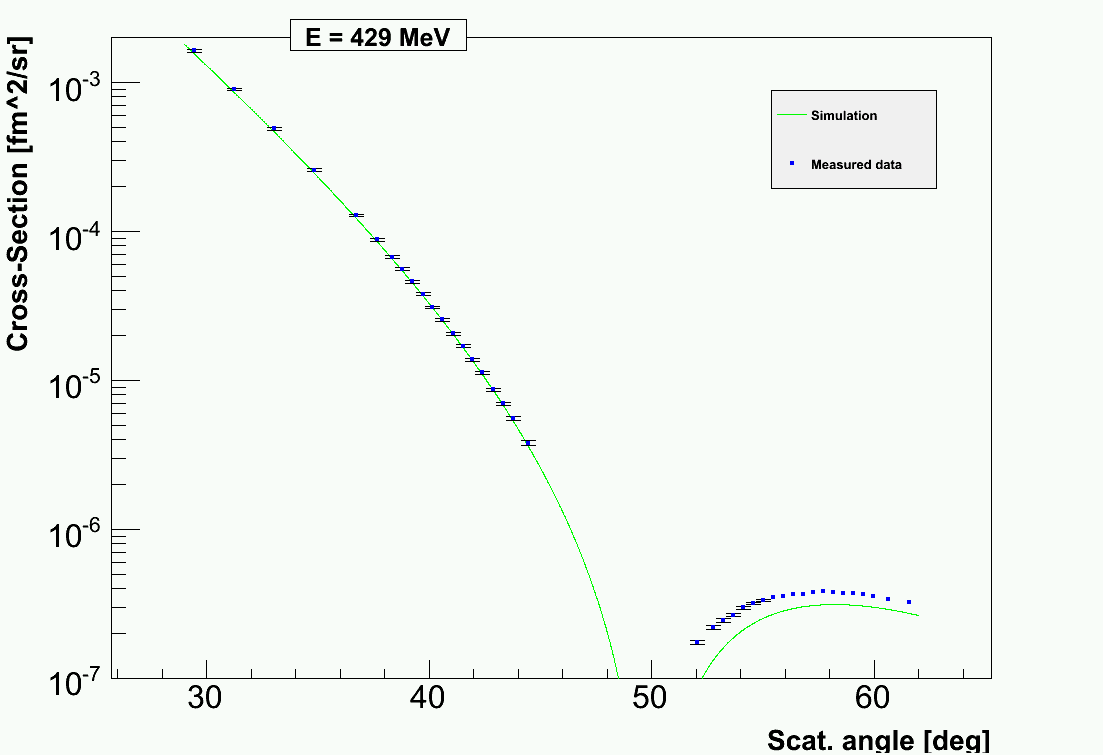
Carbon Elastic Cross-Section Simulation
I am using Doug's code from Mceep in my stand-alone code. At the moment I am having some problems with my code:
4.)  5.)
5.)  6.)
6.)  7.)
7.)  8.)
8.) 
 3.)
3.) 
 5.)
5.)  6.)
6.)  7.)
7.)  8.)
8.)