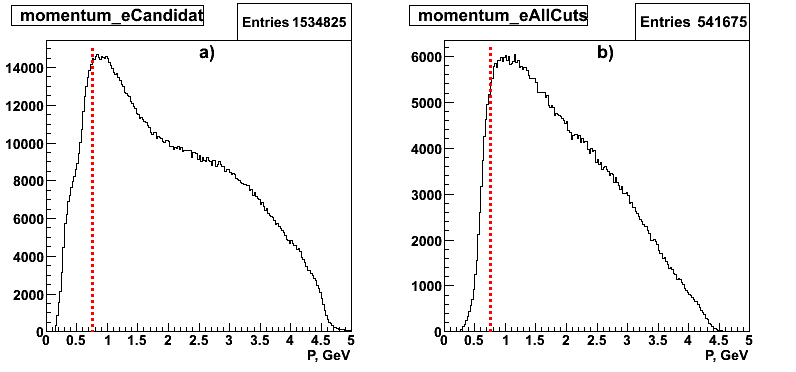
Momentum cut.
Pmin = 0.64 GeV. Due to ratiative processes we impose a cut y<0.85 which is equivalent to P>0.75 GeV.
Fig.1: a) electron candidate satisfying negative charge and time-based tracking b)electrons sat. all the Id cuts but the momentum.
Cerenkov signal.
Matching procedure for the CC Mirror Number and the projectile angle has been performed.
Fig.2: Projectile Theta vs MirrorNumber for a) all e candidates sat. all the ID cuts but the CC. b)electron sample after CC matching cut is applied.

Fig.3 10*Nphe distributionin each sector before the CC matching cut cuts(blue) and after(red). Vertical line corresponds to hte Nphe cut.

Nphe cut is sector dependent due to calibrations. However, Nphe cut eventually is not nessesary if appliying CC matching since the last cut removes pion contamination at low Nphe gains, so applying additional Nphe cut for this area leads to removing good electrons. If applying this cut, the number of pi0 would decrease by 3%
Fig.3a Example of Pi0 mass distribution for the events where electrons: a) correspond to the signal in CC such that Nphe>NpheCut (black). The distribution in red on the right-hand plot corresponds to the events w/o any Nphe restriction. b) electrons belong to the region of Nphe < NpheCut for each sector

Sampling fraction.
Fig.4a Etot/P vs P for all electron candidates.

Fig.4b Etot/P vs P for all electrons satisfying all ID cuts but P and Sampling cut. Left to right: Carbon, Iron, Lead intergrated over 6 sectors.
NOTICE! Number of events on the plots is not representive of the full event sample on a given target.

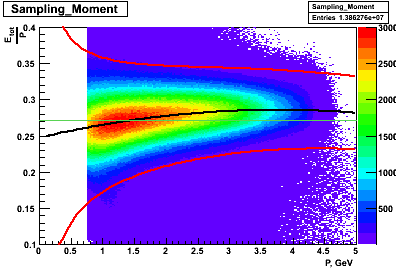

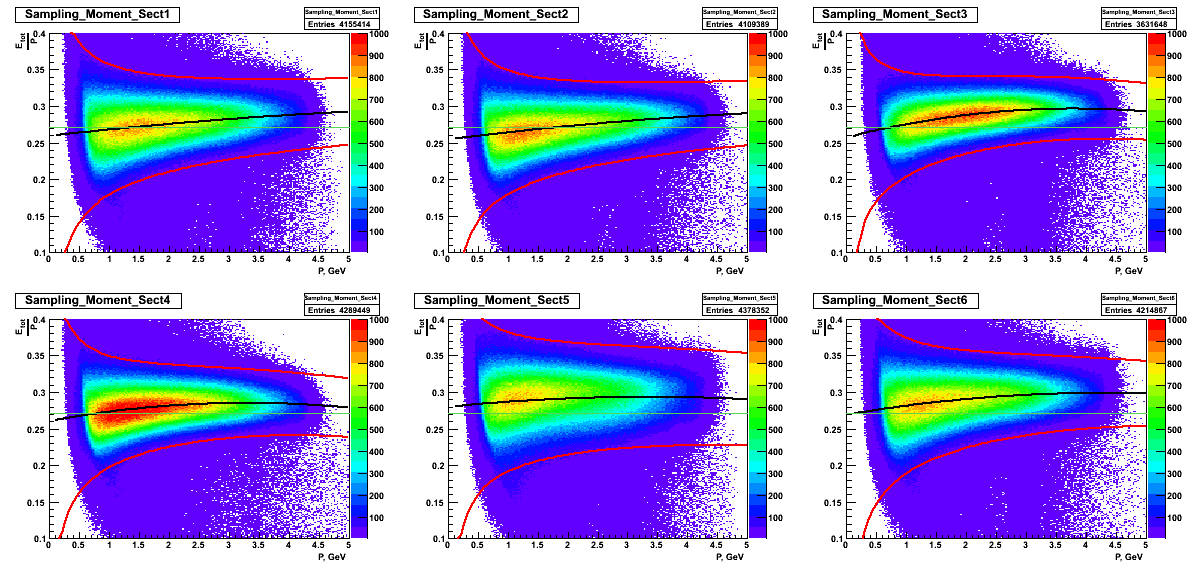
The sampling fraction cut is constructed such that: |Etot/P-M(P)|<2.5*S(P), where M(P) and S(P) are the mean and the sigma of the fit in each sector.
Fig.5a,b,c are Etot/P vs P distribution for e candidates satisfying all ID cuts but the sampling fraction cut.
Red lines are 2.5*S(P), black line is M(P) from the fit
Fig.5a CARBON TARGET+DEUTERIUM

Fig.5b IRON TARGET+DEUTERIUM

Fig.5c LEAD TARGET+DEUTERIUM
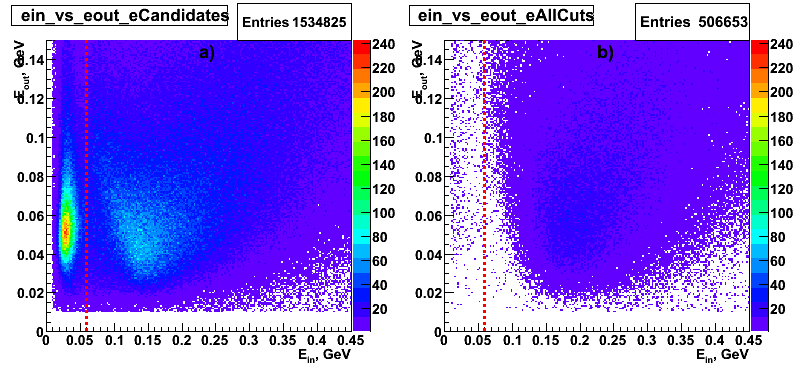
Inner energy cut.
To suppress MIP following cut is imposed: Ein > 60 MeV.
Fig.6 Eout vs Ein for : a)e candidates sat. negative charge and time-based tracking b)e sat. all the cuts but the Ein
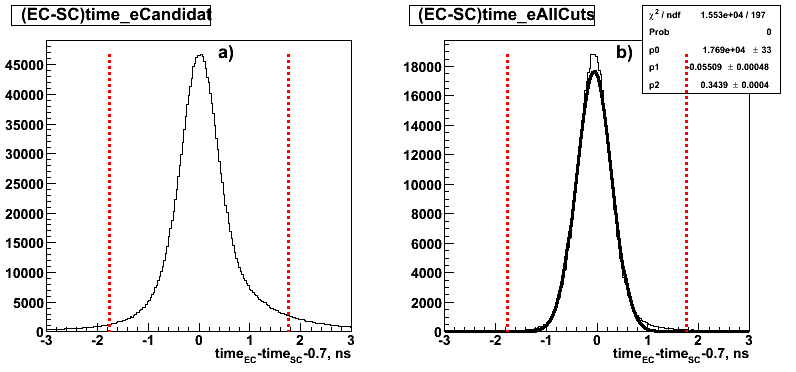
EC and SC coincidence time.
Accidentals are suppresse by applying following cut: |t(EC)-t(SC)-0.7|<5*S(dt), where S(dt) corresponds to the width of the guassian fit to the EC and SC time difference for e candidates sat. all the Id cuts but the coincidence time.
Fig.7 Distribution of t(EC)-t(SC)-0.7 for: a)e candidates (charge+track) b)e sat. all Id cuts but the coincidence time. Red dotted lines correspond to the borders of the cut.
EC fiducial cuts.
EC geometric cut excludes events that do not sat. following cuts: 40 < U < 400, V < 360, W < 390 cm. Fig.8 Distribution of the U, V, W. Red lines represents cut on the corresponding coordinate.
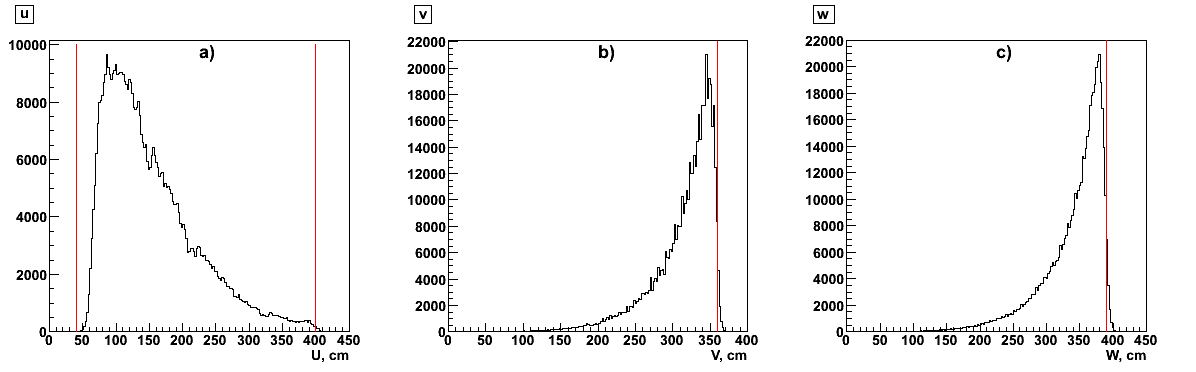
Fig.9 Y vs X distributions before(black) and after(color) U, V, W cuts are imposed. a) e candidate b) e satisfying all the Id cuts but the EC fiducial cuts.

After applying all electron ID cuts one can observe the wholes in sector 3 and 5. Sector 3 whole is caused by applyinh electron momnetum cut :P>0.75 GeV. Sector 5 whole is caused by applying coincidence time cut:|t(EC)-t(SC)-0.7|<5*S(dt). Coincidence time cut cant be omitted due to the fact that for the electron ID the TDC calibrations are of not significant importance.
Fig.9a Yvs X distribution corresponding to : a)e candidate b)e candidate from a) satisfying P>0.75 GeV c)electron candidate form b) satisfying coincidence time cut.

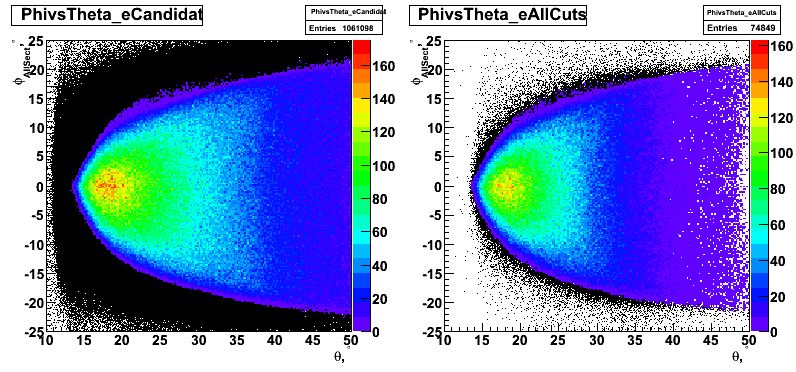
DC fiducial cuts.
Fig.10 phi vs Theta distribution before(black) and after(color) applying DC fiducial cuts for: a) e candidate b) e satisfying all the Id cuts but the DC fiducial cuts.
Vertex correction.
In order to correct vertex of the tracks due to the beam offset, imaginary beam plane (0,0,0) is being rotated to the real beam plane(-0.043,0.33,0) and the midplane of each sector is projected to the sector1. Typical position resolution is ~0.3cm. The vertex position for the target is now sector independet and defined as: -31.8 < Zcorr< -28.4 cm for deuterium target, and separately for each of the solid targets ( www.jlab.org/~mineeva/Vertex_Correction) The reconstruction of y position is worse as compared to the z, therefore to decrease the background under each target the folowing cut is applied as well for both targets: -2.4 < Ycorrr < 2.0 cm.
Fig.11 Distribution for all the electrons sat, Id cuts plotted as: a) Phi vs Z b) Phi vs Zcorr

Kinematics.
DIS kinematic constrains: Q2 > 1GeV2 and W > 2 GeV.
Fig.12 Q2 vs Xbjorken for: a)Full kinematic range in Q2 and W b) in the DIS range with Q2 and W cuts imposed.

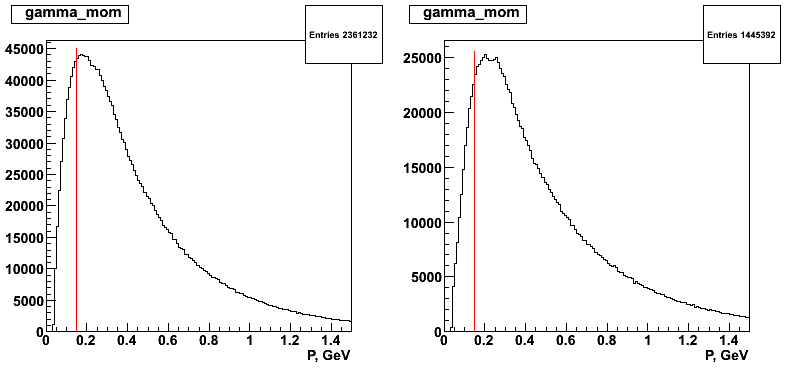
Momentum cut.
Pmin>0.15 GeV depositd in EC is required.
Fig.1 Photon momentum plotted for : a)All neutral tracks wit the hit in EC b) Photons sat. all the photons' ID cuts but the momentum.
Particle velocity beta cut.
0.95 < beta <1.95.
Fig.2 Beta plotted for : a)All neutral tracks wit the hit in EC b) Photons sat. all the photons' ID cuts but the beta cut. Red lines show the beta cut.

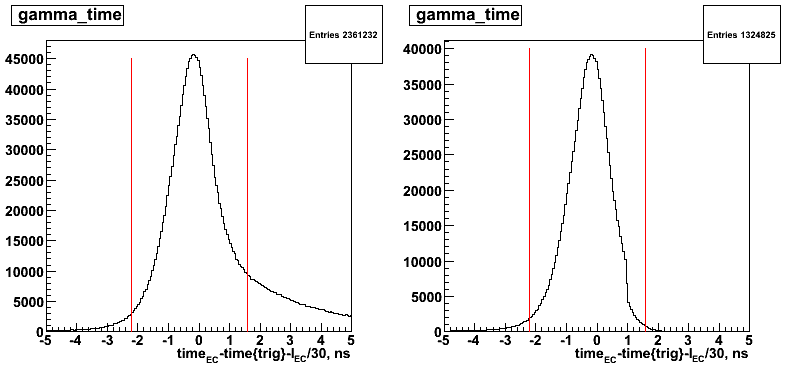
Matching of EC time with the path the photon traveled in EC.
Assuming beta=1 and speed of light is 30 cm/ns, the following cut is applied: -2.2 < t(EC)-t(start)-l(EC)/30< 1.6 ns. This cut is complimentary to the beta<1.95, however the application of it givesa a slightly stronger constrain on photon ID.
Fig.3 t(EC)-t(start)-l(EC)/30 plotted for a)All neutral tracks wit the hit in EC b)Photons sat. all the photons' ID cuts but the time cut. Red lines represent the coincidence time cut.
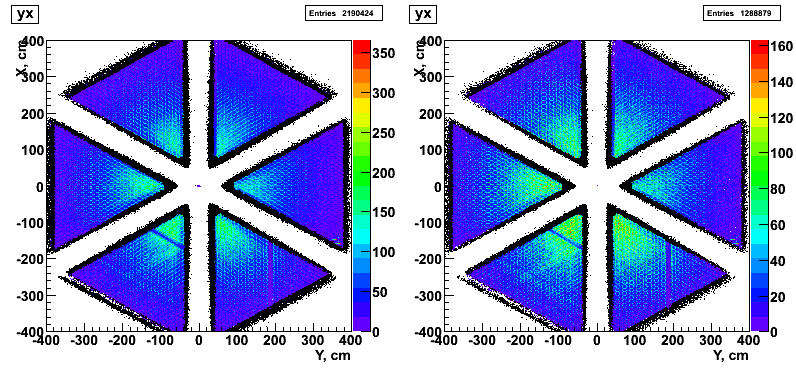
EC fiducial cuts.
Applied cuts are following: 40 < U < 410, V < 370, W < 410 cm.
Fig.4 Photons' U, W, V distribution. Red lines correspond to the each of the U, v, W cuts.

Fig.5 X vs Y global coordinates distribution for : a)a)All neutral tracks wit the hit in EC b)Photons sat. all the photons' ID cuts. Black corresponds to the area before the cut and coloar afetr the U, V, W cuts are applied.
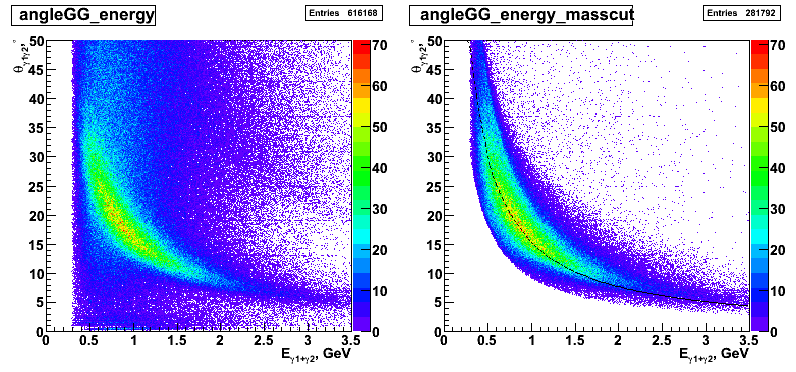
Opening angle between two photons.
To supress accidentals, one can apply an energy dependent two-photon opening angle cut or similarly a mass range cut of neutral pion. The later was applied.
Fig.1 Opening angle vs pion energy for all neutral pions events (left) and events that satisfy the mass range cut (right). The black dashed curvecorresponds to the theoretical value of the minimum opening angle between two photons.
Two-photon invariant mass.
Fig.2 neutral pion distribution for the liquid D target (left) and solid C (right). The distribution was fitted with a gaus+background function.The background is plotted in blue and the pion peak with background substructed is plotted in red.

Fig.OLD results. CARBON mass peak from DATA

Fig13a Carbon mass with Z>0.4 cut applied

Fig.13b Carbon mass peak from SIMULATIONS
