Fig.1a distributions of pT2 for D + C, Fe, Pb. Left - Deuterium, Middle - Solid,
Right - D and Solid with their background substracted (black):


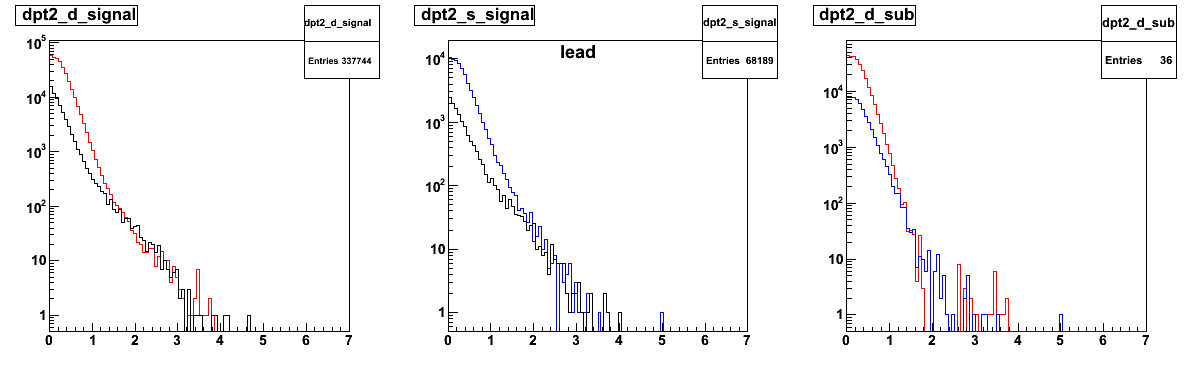
Fig.1b distribution for D + S with background substracted (right in 1a plots):
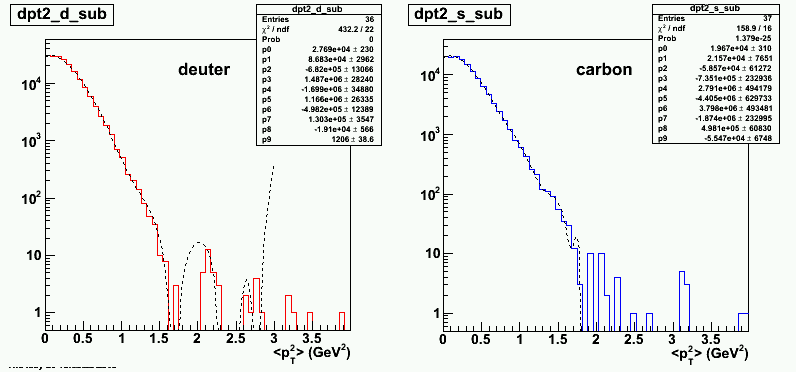
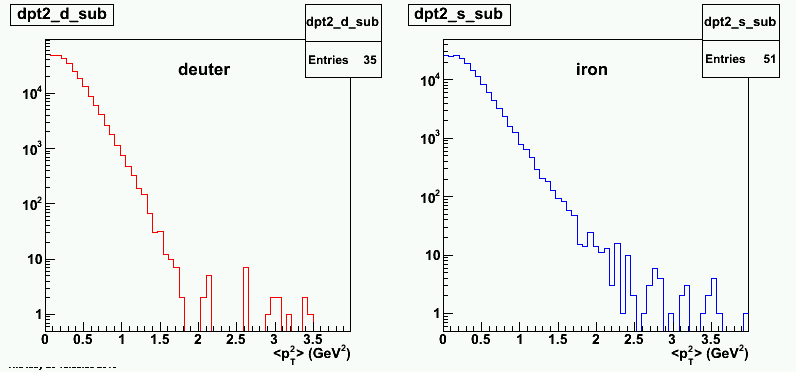

Fig.1c pT2 broadening for C, Fe, Pb at: left - full range , right - cut-off at 1.6 GeV2:
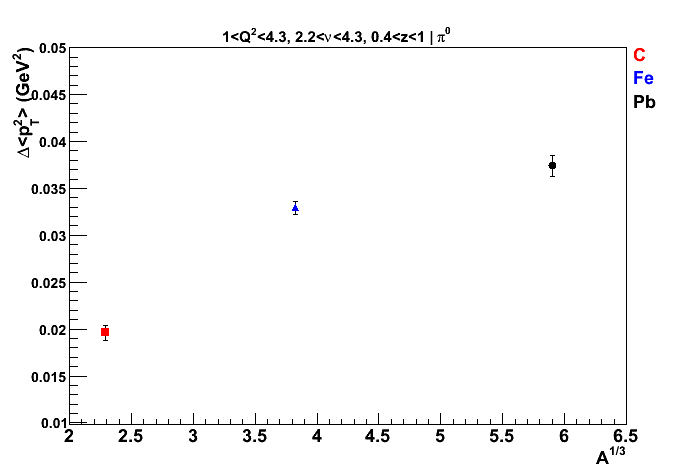
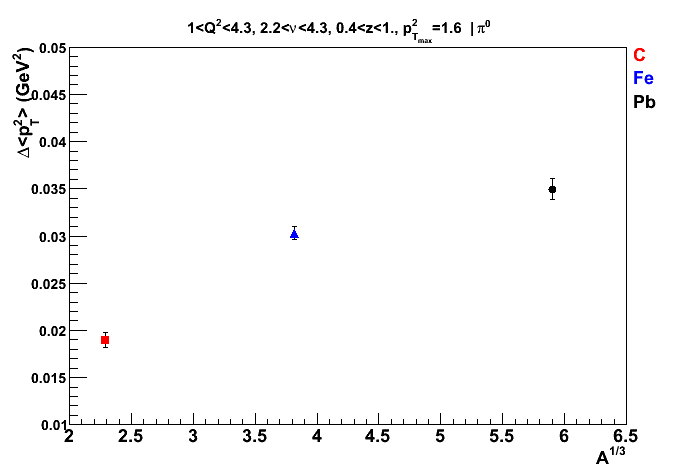
Fig.2a pT2 distribution cut off at 1.6 GeV2 for two nu bins : 2.5< nu <3 (plots on the left) and 3.5< nu <4 (plots on the right)
From top to bottom C, Fe, Pb correspondingly. Color - signal within 2sigma of pi0 mass, black - background 4 sigma
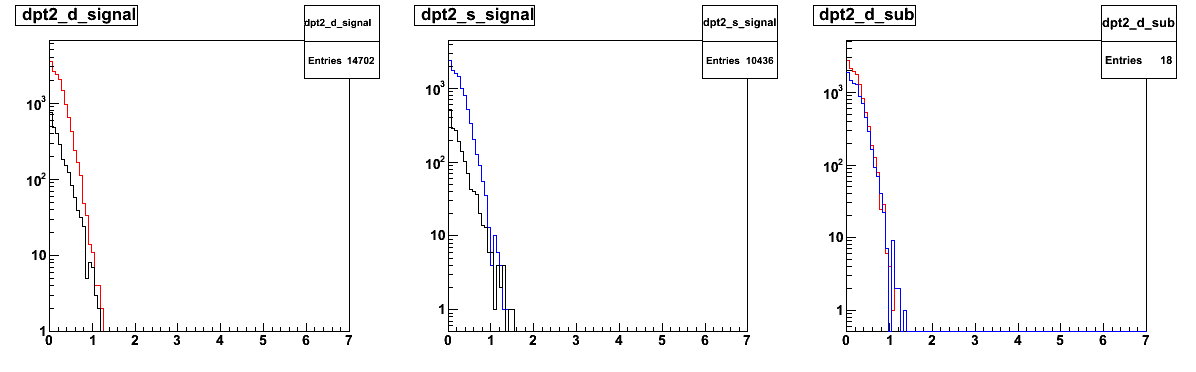
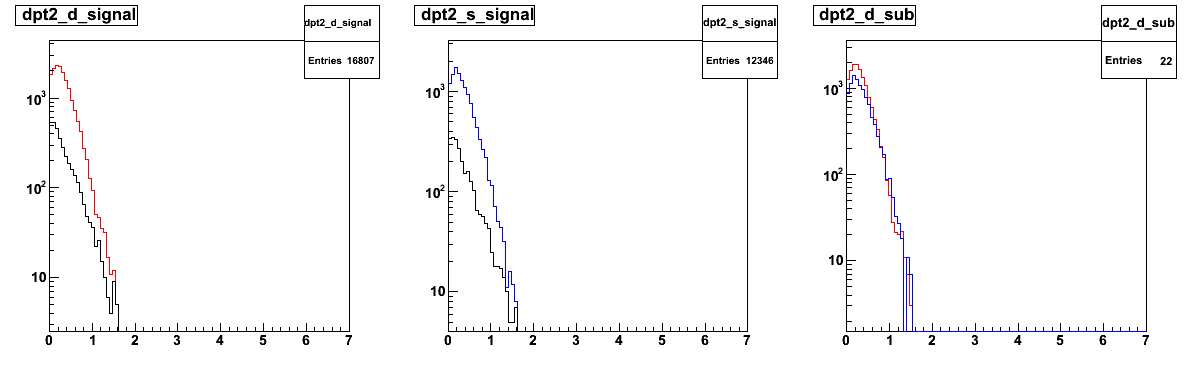


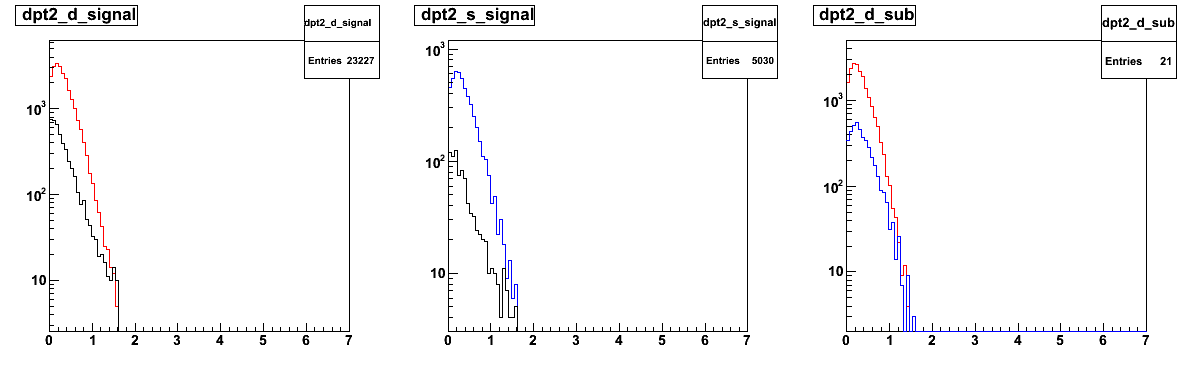
Fig.2b < pT2 > broadening for nu bins. Left - pi0 with pT2 cut-off at 1.6 GeV2; Right - pi- from Raphael
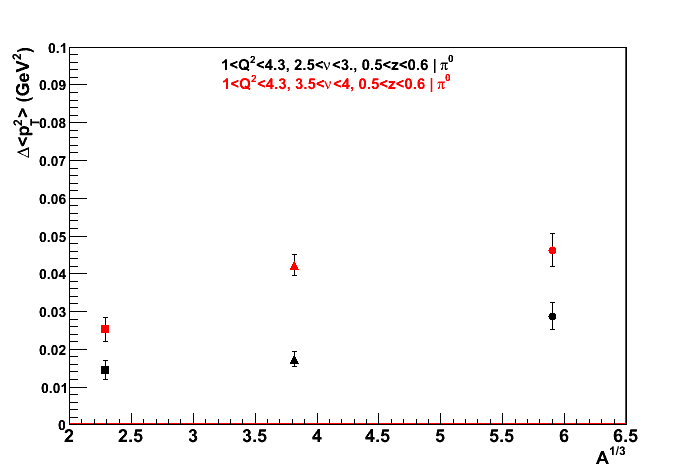

Fig.2c d< pT2 > for two other nu bins: 3< nu <3.5 and 3.5< nu <4.3 with pTmax=1.6 cut-off:
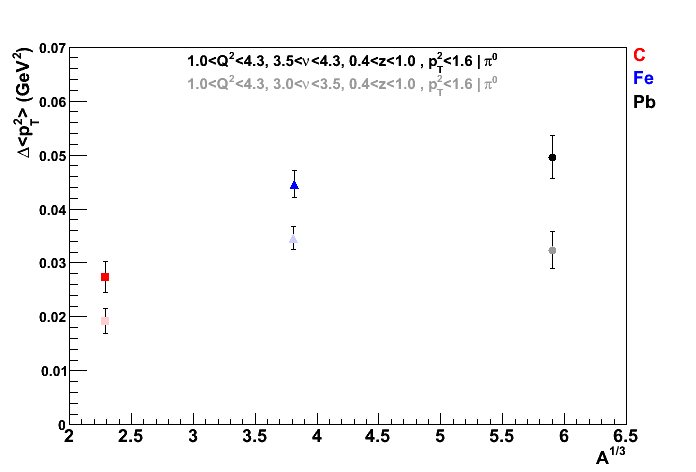
Fig.2 Comparison of dpT2 vs A1/3 in bins of nu. FULL RANGE IN PT2 (left) vs PT2_max=1.7 GeV2 (right)


Unless othewise specified, 1< Q2 <4.2 2.2< nu < 4.3 0.4< z <1
Fig.3 Average momentum broadening for C, Fe, Pb depending on the choice of the averaging limit,
i.e pT2min = 0 and pT2max varied:

Fig.4 Taking 0< pT2 <1.7, concider d< pT2 > for variable nu-binning:

Fig.5 Taking 0< pT2 <1.7, concider d< pT2 > for variable Q2-binning:
