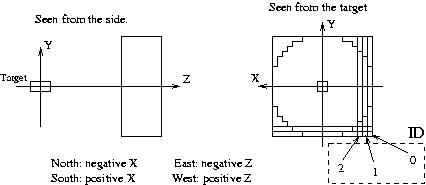
The current geometry definitions (see figure) are outlined as follows:
The color of each LGB, represents the amount of energy deposit in that LGB. The color bar to shows the energy scale. For calibrated data, it is given in MeV; otherwise the colors simply represent ADC channels above pedestal. The data are (by default) pedestal-subtracted; only the LGBs that had a nonzero energy deposit above pedestal are colored; the rest remain white. Pedestal subtraction can be turned on/off via the Options Menu.
Each cluster of colored blocks corresponds to a photon hit, and the pattern recognition program (the Clusterizer) can then reconstruct position and energy of the photon. This analyzed data is represented by a circle centered on the reconstructed photon and with a radius proportional to its energy.
The color of each RPD segment represents the ADC value; it is not pedestal-subtracted, and the scale is quite different than that for the LGD.
The RPD is no longer in use; therefore, Event checks the run number and displays the proper detector configuration using the BSD and BGV for more recent runs.
The BSD and BGV are now being displayed on the main view with the LGD. Each of these detectors is represented by a 24-gon surrounding the LGD. The inner most 24-gon represents the straight counters of the BSD. The color of each BSD segment represents the ADC value; the scale is set up to show a wide spectrum for the ADCs although it is not the same as that used for the LGD. The 24-gon located in the middle represents the downstream counters of the BGV while the outermost 24-gon represents the upstream counters of the BGV. Again, the color of each segment of the BGV represents the ADC value while using a very different scale from that used for the LGD. If a TDC hit falls within a time window determined by the run, the BSD and BGV segments are drawn with a white bar with black ends. For more detailed information about the BSD, there is a BSD view that can be opened.
The Filename, Run number, Event number and the trigger type (Physics, LGD Laser monitor, Pedestal, Basetest/Scaler) are indicated above the detector.
CPV and UPV Displays: The CPV and UPV views have now been created. Each view is a two dimensional representation of the detectors, looking down stream. The CPV is scaled to match the Lead Glass Detector as it is in reality. Similarly, the UPV is drawn to scale with the rest of the views. Both the CPV and the UPV displays are equipped to display ADC hits and TDC hits (within a specified time window) graphically and textually. The ADC hits are represented on a color scale where white is zero and red is a specified maximum. In order to show both TDC and ADC information simultaneously, a colored vertical striped pattern is used. If a TDC hit falls within the time window (determined by the run), the CPV or UPV paddle is drawn with the vertical stripe. The color of the stripe is determined by the ADC value corresponding to that particular paddle. If no TDC is discovered, the paddles display a solid color corresponding to the ADC value. To determine the exact value of the ADC and TDC hits, mouse feedback has been installed. Moving the mouse pointer over a paddle will display the paddle's number designation, its ADC and TDC values.
CPV and UPV BUGS For some reason, the feedback windows fail to initialize properly on startup of the Event display and does not display any information. It seems to do this randomly although suggestions of a hidden memory leak deep within Hv.h have been made. It could also have something to do with how and from where you attempt to use the program. Unfortunately, the only method that has been known to correct this situation involves quitting Event and restarting it. Most of the time, Event works fine.
The only other problem noticed is an erratic behavior involving the textual feedback of the TDC hits in the CPV display. Previously, a non TDC hit was displayed as "0.0 ns". This was deemed to be potentially confusing so attempts are being made to display a "blank" instead. This has made the TDC feedback in some paddles to flash a blank when the cursor is moved or to flash the value when moved. The values are correct but hard to look at when they flash.
BSD Display: The BSD view has now been created. The view is a two dimensional representation of the detector with the BSD cylinder shape unfolded. The view is drawn with the straight, left, and right counters of the BSD shown as they overlap and lay in reality. In each straight counter there are 9 pixels. The lower left hand corner of the view is the pixel containing the overlap region between S0, R0, and L0. The counters are all numbered from left to right in increasing order starting with this pixel. The bottom of the window is the upstream end of the counters while the top of the window is the downstream end of the counters. The BSD display is equipped to display ADC hits and TDC hits (within a specified time window) graphically and textually. The ADC hits are represented on a color scale where white is zero and red is a specified maximum. In order to show both ADC and TDC information simultaneously, a horizontal hatching system is used. If a TDC hit falls within the time window (determined by the run), the BSD counter is drawn with horizontal stripes. The the color of the stripe of the straight counters is determined by the ADC value corresponding to that counter. The color in the right and left counters is also determined by the ADC value corresponding to that counter while the stripes are actually black. If no TDC value is present, the counters display a solid color corresponding to the ADC value. In order to determine the exact value of the ADC and TDC hits, mouse feedback has been installed. Moving the mouse pointer over the counters will display the pixel designated by the correct straight, right and left counter with each counter's ADC and TDC value.
Tagger Display:
A beam energy select button is also available in order to adjust the beam energy for older runs. Currently the default value is 5.5 GeV. Still to come: The beam energy is read from a data file.
Note: The TDCs in the feedback are currently being displayed in nanoseconds where the TDC channel is read and then converted to nanoseconds using a scaling factor specific to each detector. The CPV, UPV, and BSD are all 0.5ns per count while the tagger is 0.2ns per count.
Note: A color monitor (at least 8-bit 256 color) running X-windows is required!
To start the program, simply type:
Event
assuming you have already done
source ~radphi/setup
to setup the RADPHI environment variables etc. The display will appear
in a new window. To exit the program, choose `Action'
in the menu, and then press `Quit'. An alternative
method to exit is to click with the right mouse button on the blue background
to the view and choose Quit...
Data can come from an itape file, and itp file, from standard input (stdin) or from online data provided by the DD-ring and the Dispatcher program.
The compiled program consists of five subprograms, where setup.c contains the main program. The other four subprograms Event.h, main.c, init.c and feedback.c are minor routines controlling the 'surroundings' of setup.c.
To rebuild the executable after changing or adding code, one will have
to type
make Event
The compiled program consists of five subprograms, where setup.c contains the main program. All the code is checked into CVS. The other four subprograms Event.h, main.c, init.c and feedback.c are minor routines controlling the `surroundings' of setup.c. The graphics is based on Hv ( HotViews; Hv is a library package of extra, mainly graphics, routines for C, developed by David Heddle. It is layered on top of X and OSF Motif. See Computers in Physics, 10, 174 (1996). The CLAS Event Display ced was also written using Hv.
Much of the detector geometry, calibrations etc. is at present hard-wired
into the code - only the LGD pedestals and calibrations are read properly
from the database...
Room 212  Small Hall
Office (W&M):     (757) 221-3489
Jefferson Lab:    (757) 249-5856
FAX:              (757) 221-3540
E-Mail:

Davidarmd@.physics.wm.edu
cation.dsla
Snail-Mail: Dept. of Physics
College of William and Mary
Williamsburg, Virginia 23187 USA
last updated July 24, 1999