

I need to point out that much work was done analyzing this data by Carlos Salgado, Dennis Weygand and Mina Nozer. While the analyses I present here was done independantly, it includes ideas from many discussions with them as well as others at the weekly PrimEx meetings.
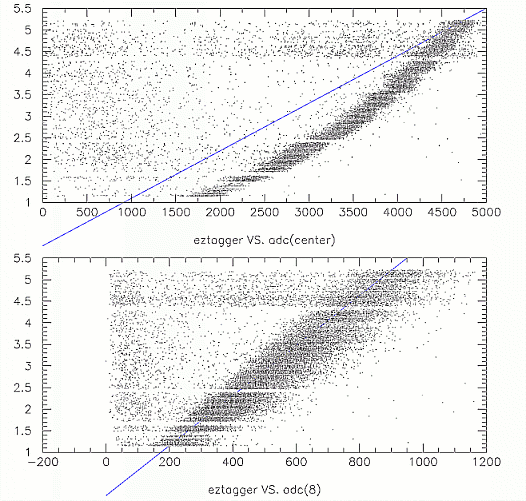
The data exhibited some clearly non-linear behavior with respect to the tagger energy. This is shown here in a plot of tagger energy vs. adc value for crystal 8 (the crystal in the center of the 9 chinese_new). The band at higher ADC values comes from data when the beam was centered on this crystal. The other overlapping bands come from when the beam was centered on neighboring crystals.

The non-linearity was only evident in whichever crystal the beam was centered on (i.e. when the phototube saw lots of light). Here, plots of tagger energy vs. (pedestal subtracted) ADC value are shown for when the beam was centered on crystal 8 (top) and a neighbor (bottom). The blue lines are drawn from 0,0 to demonstrate the extent of the non-linearity(linearity) of the top(bottom) plot.
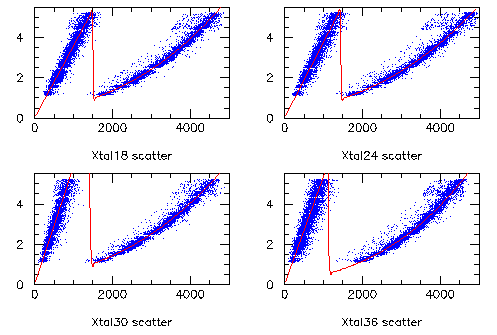
The non-linearity w.r.t. the tagger energy was removed by fitting a piece-wise function to data from beam-centered and beam-centered-on-neighbor conditions. This was done for each crystal independantly. A few examples are shown here. Since the average fraction of the shower seen by the crystal with the beam centered at different positions is not known precisely, a parameter K was included in the function and allowed to vary in the fit. The parameter K represents the ratio of the energy fraction seen by the crystal with the beam centered on it and that seen by the crystal with the beam centered on the neighbor. The curve is linear up to the "transition point" (another parameter varied in the fit) where it then changed into a 3rd order polynomial. The two functions were required to be continuous and smoothly varying at the transition point (after scaling the ploynomial by the factor K.
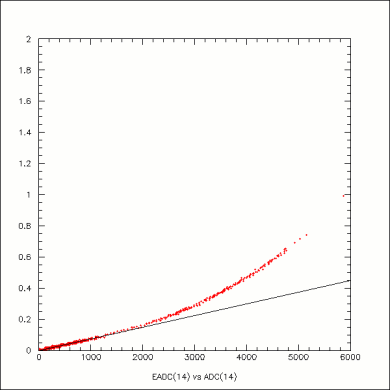
Here is an example of the non-linearity correction function. In this case, crystal 14. The Y-axis is in arbitrary units, but is proportional to what a linear response would be given the actual response on the X-axis. The line helps show how much the response deviates from linearity.
Here now is a plot of the tagger energy vs. the non-linearity-corrected ADC value for crystal 14. The linear response w.r.t. the tagger energy is typical for all crystals in the array.

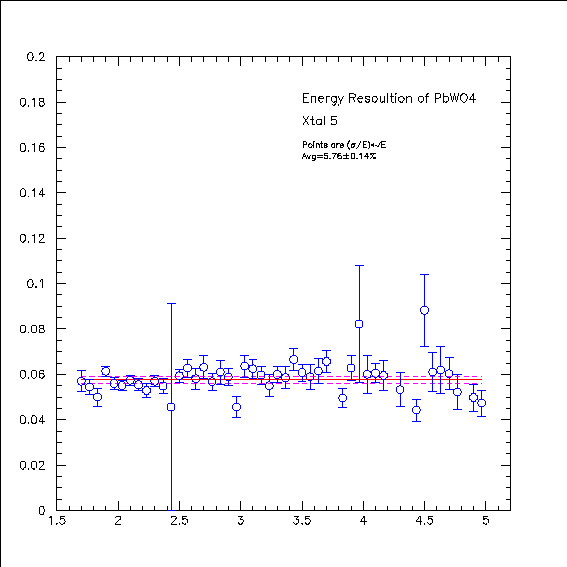
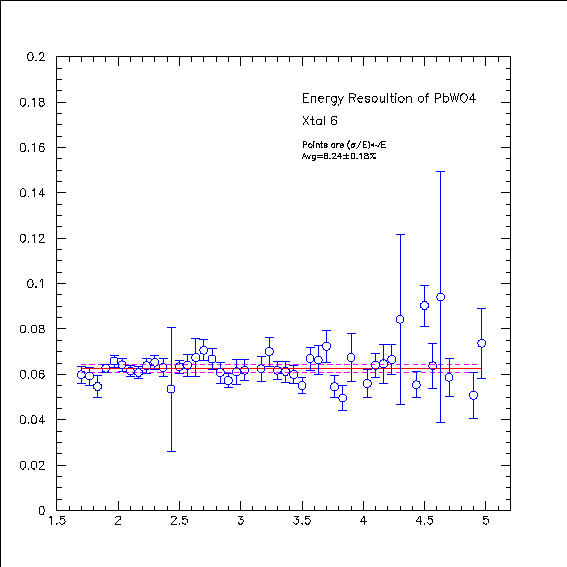
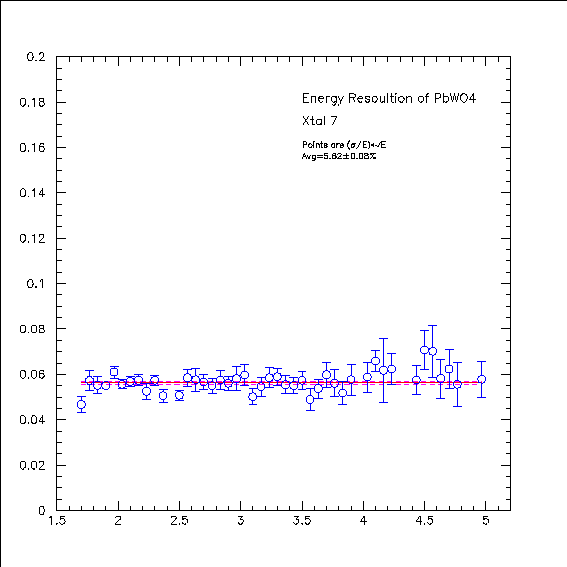
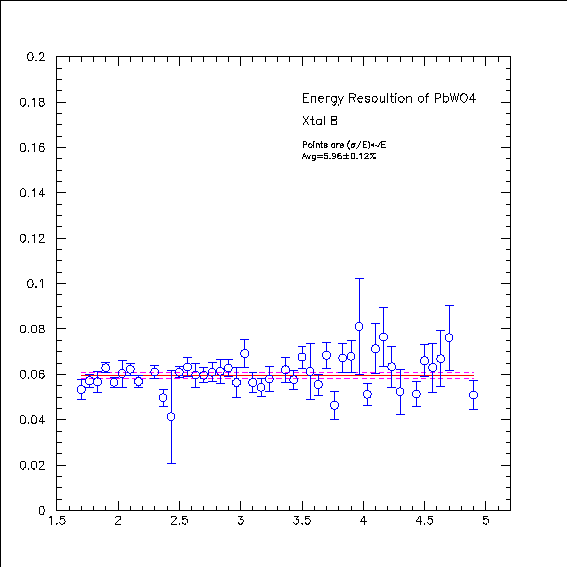
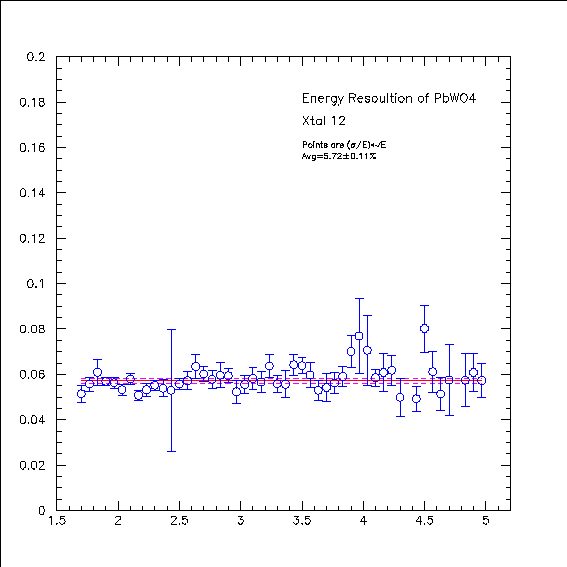
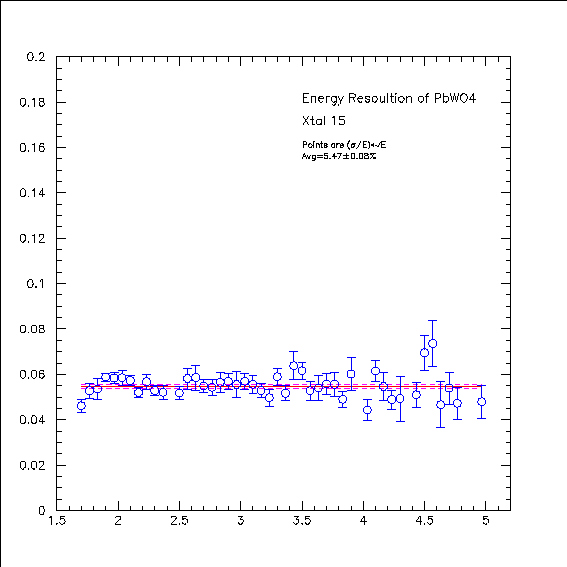
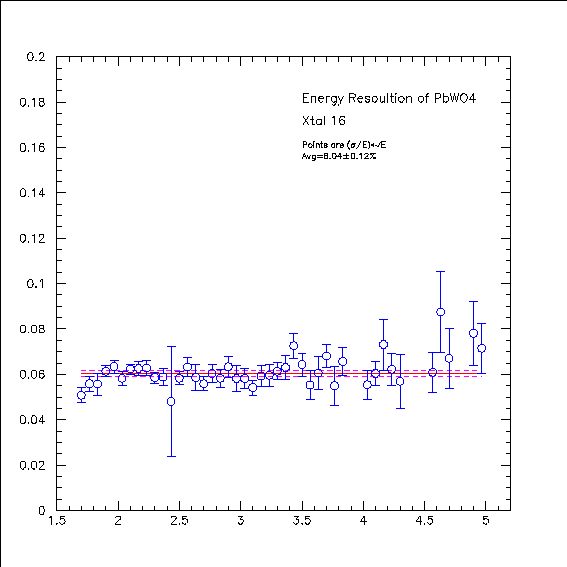
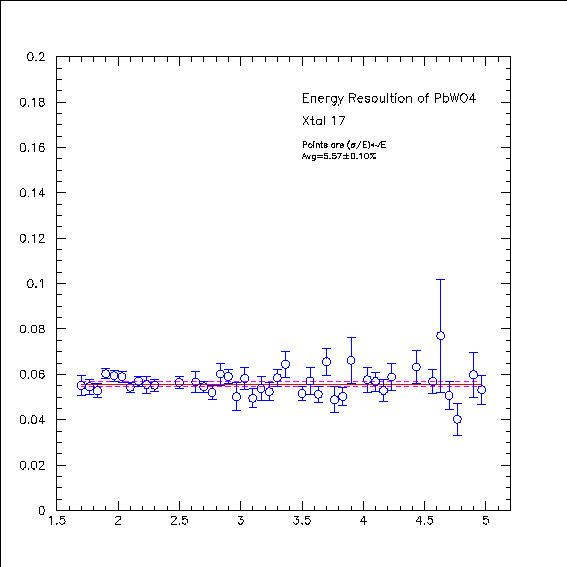
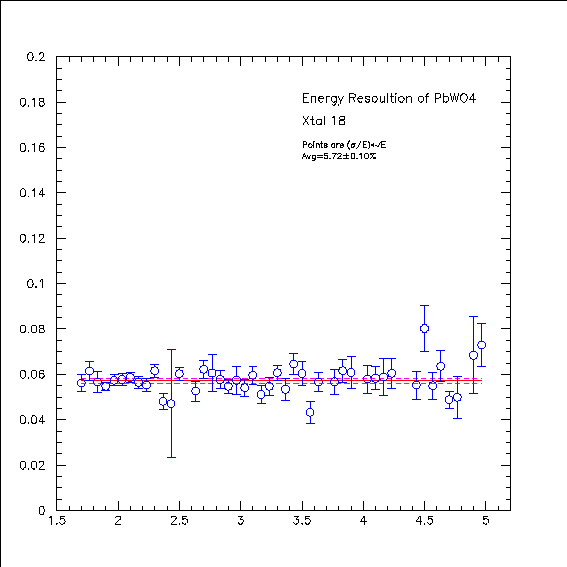
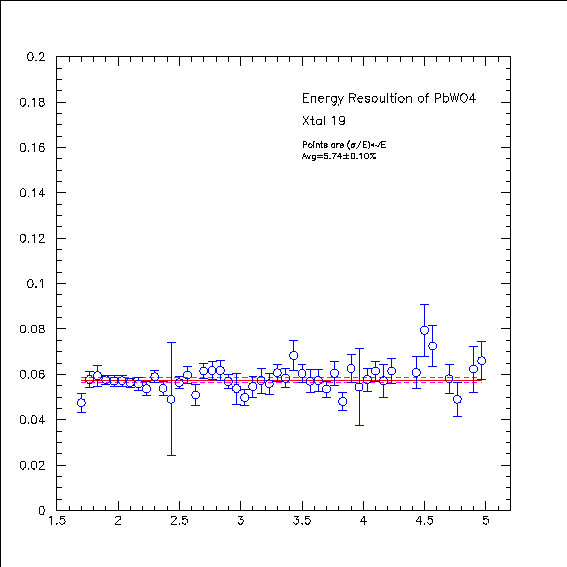
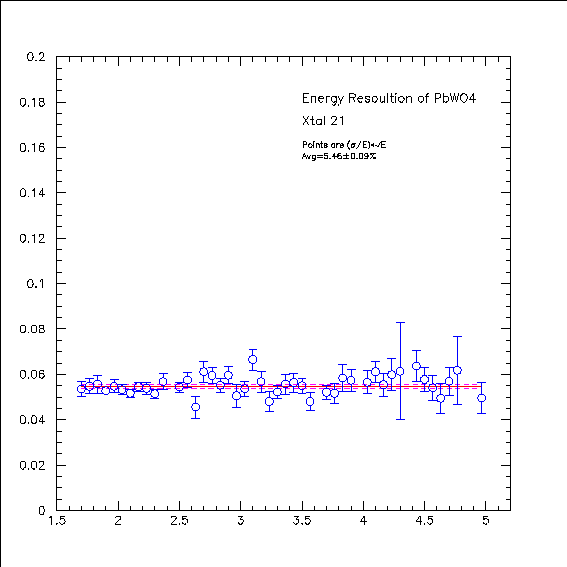
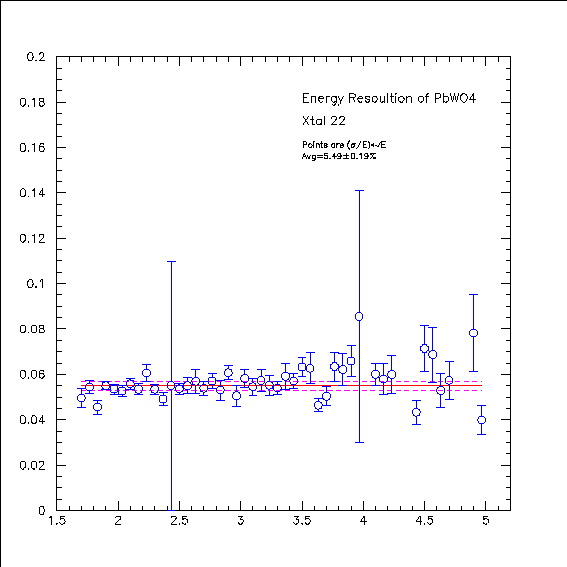
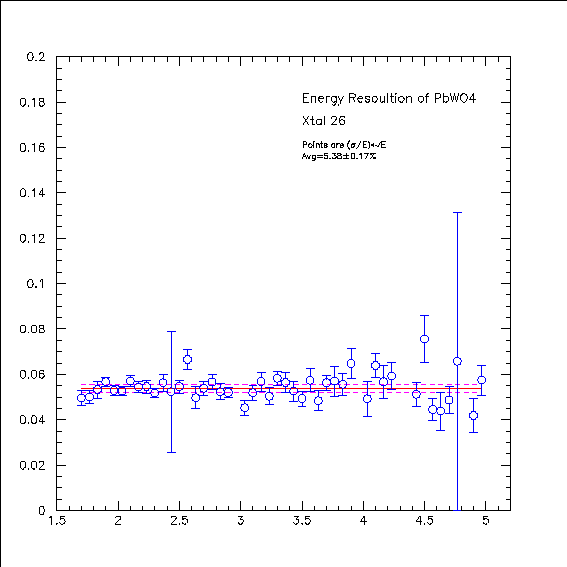
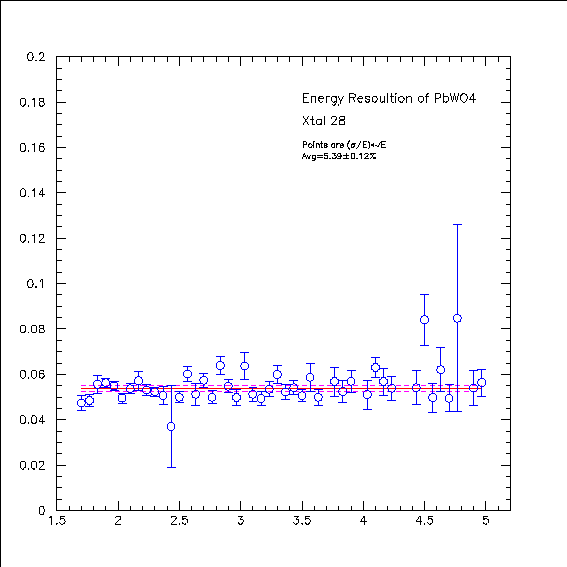
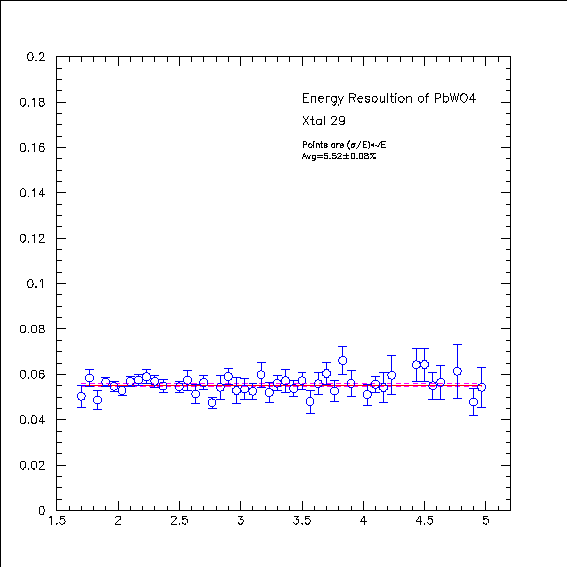
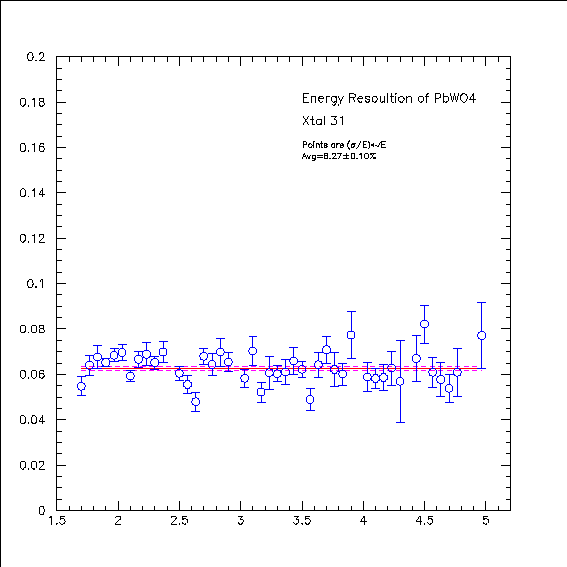
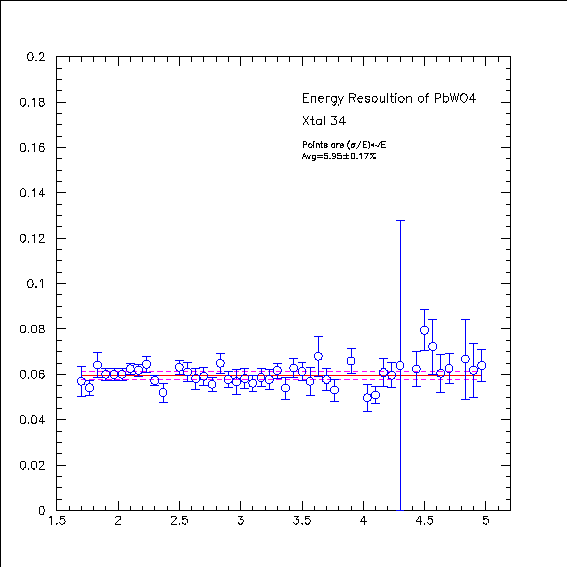
In an attempt to make a comparison between the different crystals, the resolution of each crystal was measured from data taken while the beam was centered on it. The resolution as a function of incident photon energy was determined for each crystal independantly. The table shown here lists the weighted averages of of these for incident photon energies bewteen 1 and 5 GeV. Note that these values do not have the contribution due to the energy bin widths removed. The point of this exercise ,however, is to make a relative comparison between the different crystal types.

The detailed plots from which the above values were taken can be seen by clicking on the links in the following table
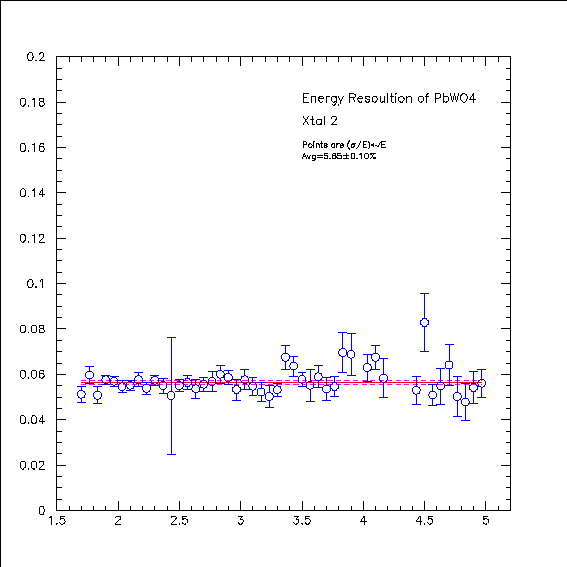
Here is a summary of the energy resolution of the PbWO4 array for individual crystals. The lines indicate weighted averages for the different crystal types.

The results of comparing the individual crystal resolutions for the different crystal types
at least shows no large difference in their performance. There is no indication here
that one vendor produces crystals of such an improved quality as to make a large improvment
in the precision of the final experiment. The primary weights used in choosing a vendor should
therefore fall to things such as price and delivery schedule.