As one of the results of the above described procedure the relative locations of had to be determined.
The location of 2C24A beam position monitor and ![]() -Profiler were read off the design drawing 28405-E-0034
and related drawings.
The
-Profiler were read off the design drawing 28405-E-0034
and related drawings.
The ![]() location of the crystal part of HyCal came from survey data. The coordinates of these beam line devices were
collected in a table below,
location of the crystal part of HyCal came from survey data. The coordinates of these beam line devices were
collected in a table below,
| device | x (cm) | y (cm) | z (cm) |
| -0.8563 | 0.0322 | 980.30 | |
| HyCAL | 0.0 | 0.0 | 731.89 |
| Target | -0.063 | 0.07 | 0.0 |
| HARP 2H00 | 0.0 | 0.012 | -65.73 |
| BPM 2C24A | 0.0 | 0.0 | -1049.99 |
In a similar manner as above, the beam position and entrance angles at the face of crystal part of the calorimeter were determined using
BPM and ![]() -Profiler information. The analysis was done for only a handful of runs shown in a table below.
-Profiler information. The analysis was done for only a handful of runs shown in a table below.
Inspection of the results shows that the average ![]() position at HyCal was quite stable,
but
position at HyCal was quite stable,
but ![]() distribution showed two well defined peaks. Therefore, the results are presented
as two separate sets, runs before run 5024 and runs after this run. The run 5024 belongs to the latter.
distribution showed two well defined peaks. Therefore, the results are presented
as two separate sets, runs before run 5024 and runs after this run. The run 5024 belongs to the latter.
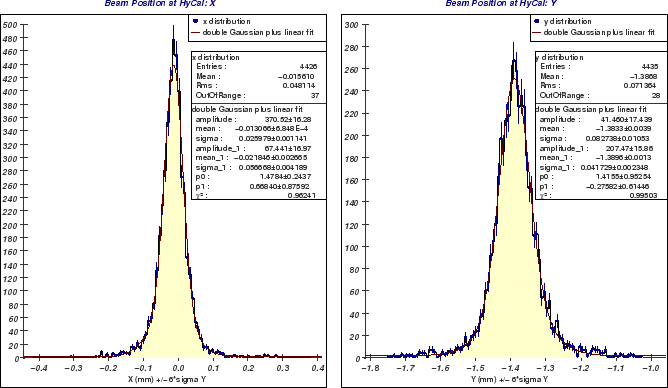
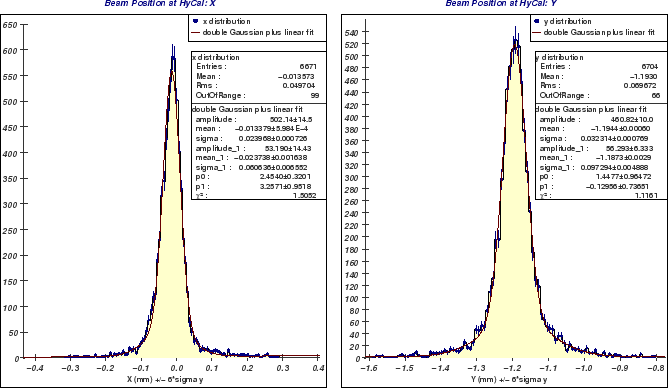
Figures 7 and 8 show the distributions of beam position in transverse directions at HyCal detector.
While ![]() coordinate seems to be well centered,
coordinate seems to be well centered, ![]() mm with the width of
mm with the width of ![]() mm, for both sets,
mm, for both sets,
![]() coordinate is off-centered by
coordinate is off-centered by ![]() mm, with the width of
mm, with the width of ![]() mm, for the first set and
mm, for the first set and ![]() mm,
with the width of
mm,
with the width of ![]() mm, for the other. It is worth mentioning that beam position as reported by 2C24A monitor has
not changed between the both sets.
mm, for the other. It is worth mentioning that beam position as reported by 2C24A monitor has
not changed between the both sets.
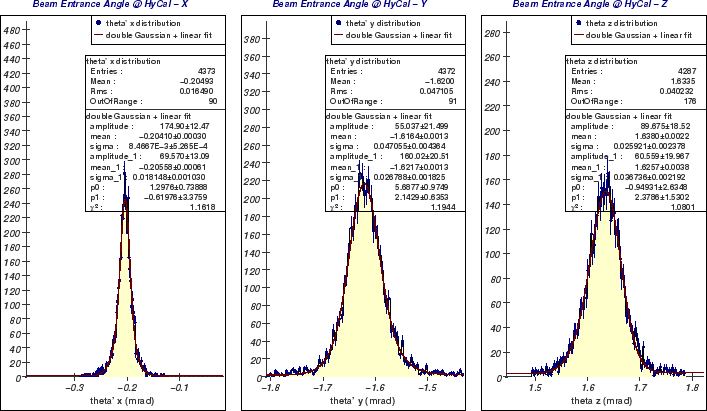
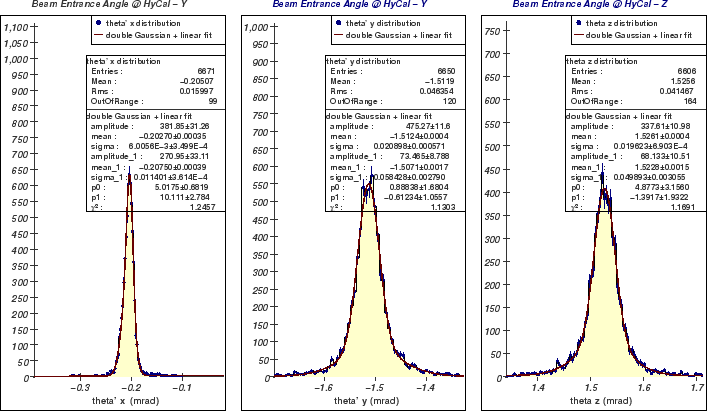
Similarly, the distributions of directional cosines were divided into two sets and Figures 9 and 10 demonstrate
the results. Again, in the ![]() direction two distinct average values are observed. In the course of the analysis directional cosines
of the beam trajectory relative to HyCal were determined. In Figure 9 the right panel shows the distribution of
direction two distinct average values are observed. In the course of the analysis directional cosines
of the beam trajectory relative to HyCal were determined. In Figure 9 the right panel shows the distribution of ![]() ,
an angle between the beam and
,
an angle between the beam and ![]() -direction. The other two angles are primed to distinguish their different definition. These are
the angles that beam makes with its projection on the perpendicular plane.
For both
-direction. The other two angles are primed to distinguish their different definition. These are
the angles that beam makes with its projection on the perpendicular plane.
For both
![]() and
and
![]() the angles are close to 90
the angles are close to 90![]() therefore one can write
therefore one can write
![]() where
where ![]() or
or ![]() and
and
![]() .
.
The widths of the
![]() and
and ![]() distributions for runs prior to run 5024 are comparable with the angular resolutions
of the experiment while the angular distributions widths after run 5024, inclusively, tend to be within experimental resolutions.
distributions for runs prior to run 5024 are comparable with the angular resolutions
of the experiment while the angular distributions widths after run 5024, inclusively, tend to be within experimental resolutions.