.
Last update Nov 4th, 1997
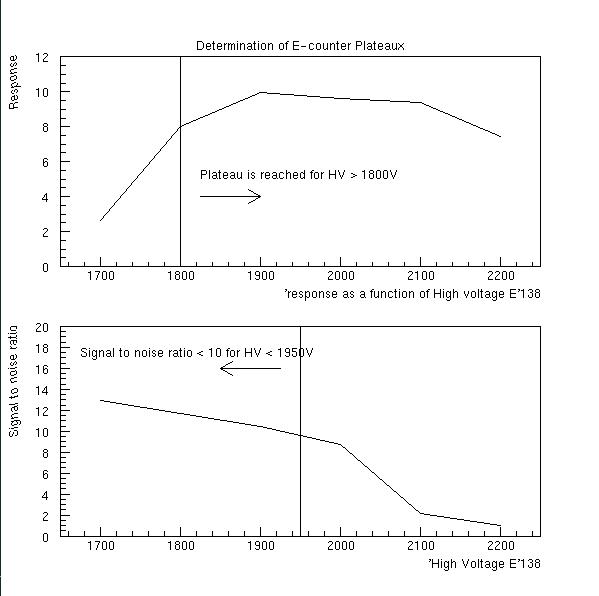
The file plateaux.ps displays not only the response of each of the 384 detectors but also their signal to noise ratios. Most detectors display the following behavior: the response increase sharply as a function of applied H.V., plateaux out, but rather than increase again once the detector saturates, it fall back down sharply. The behavior of this 'tail' is mirrored clearly in the signal to noise plots which fall sharply once a certain H.V. has been applied. The figure below shows, as an example, the response and the signal to noise ratio for E-counter 138.
From these curves it is easy to determine operational ranges for both the responses and the signal to noise ratio. In the example below the plateau is reached for High Voltages greater than 1800V, but one does note the fall off above 2100V. In the signal to noise plot, the signal to noise ratio does remain above 10 up to about 1950V. As a result, the H.V. range for the Response is greater than 1800V, but the S/N ratio is less than 1950V. This defines an optimal operational range for this counter.
Using this approach, voltage ranges are determined for each E-counters. The results are tabulated in the following files: E1-E40 , E41-E80 , E81-E120 , E121-E160 , E161-E200 , E201-E240 , E241-E280 , E281-E320 , E321-E360 , E361-E380 .
From these it is possible to set the optimum operational HV for each of the E-counters. The basic criterion used was to fix the voltages to 50V above the minimum acceptable voltages determined in the above analysis, as long as it , in general, didn't conflict with the ranges set by the signal to noise ratios. The results have been tabulated under Recommended High Voltage Settings (Frame format)