--SRC Index
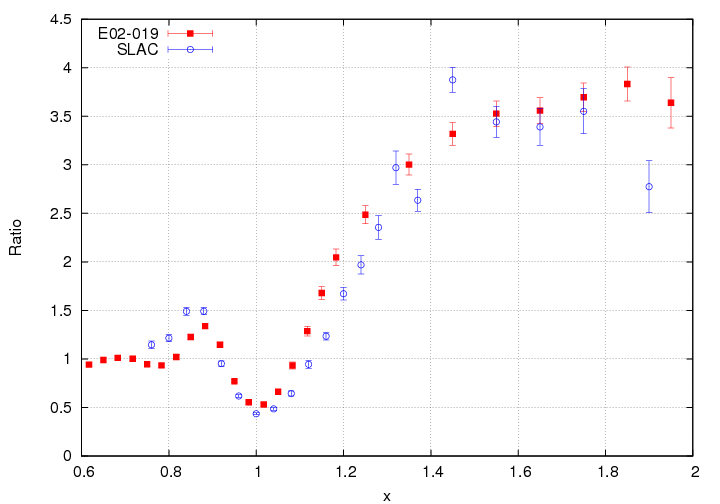
As you remember, our A/D ratios aren't as flat as one would hope. I'm plotting them along with A/D ratios from NE3 to see if it's as bad as it seems. E02-019 points include systematic errors as well.
I chose the 25degree data from SLAC, which is at Q^2~2. There's slightly higher Q^2 data, but it stops at x=1.37, so it's not useful for this.
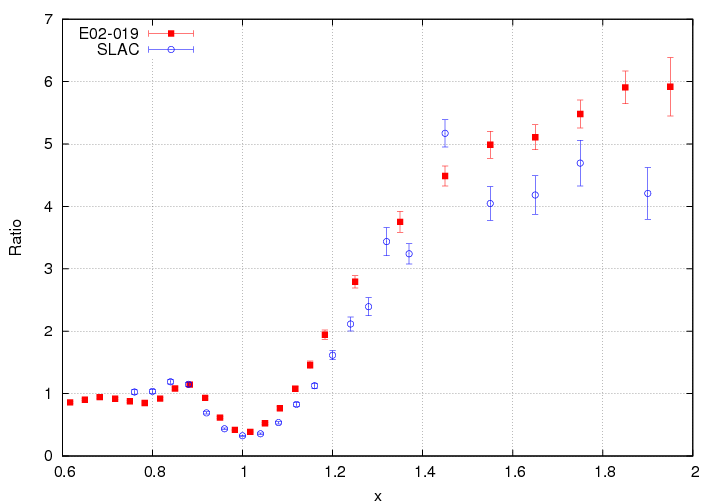
It all looks pretty good (as in, similar, not necessarily flat), until we get to the heavy targets, where they diverge. Did someone not do Coulomb corrections, perhaps?
4He ratios
=========================
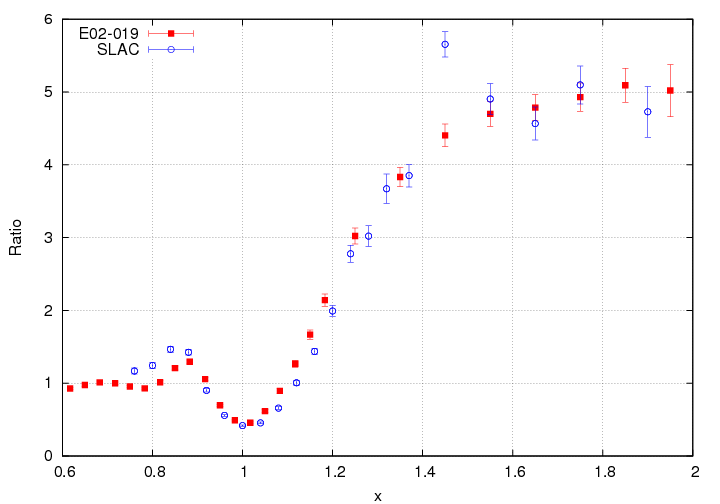
Carbon
=========================
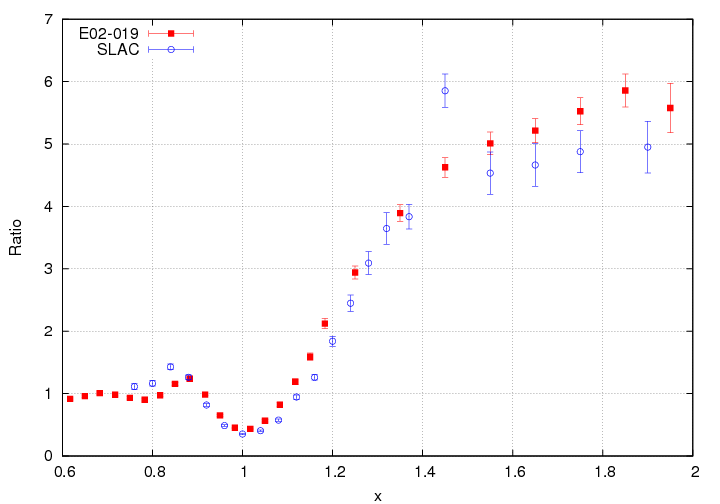
Iron/Copper
=========================
Gold
=========================
Quantifying "non-flatness" (July 21st, 2010)
So, yesterday, I just examined how much the value of the plateau changes when I vary the region over which I extract it (see here). Today, I'll just take 1.4
And here they are. The slopes are definitely higher for heavier nuclei.
A/D
====================
0.3353 +/- 0.0978 2 3
1.0849 +/- 0.1486 2 4
1.2376 +/- 0.1638 2 9
1.6466 +/- 0.2066 2 12
2.7160 +/- 0.2275 2 63
3.2658 +/- 0.2301 2 197
A/3He
====================
0.2453 +/- 0.0552 3 4
0.2919 +/- 0.0614 3 9
0.4114 +/- 0.0782 3 12
0.8968 +/- 0.0861 3 63
1.1466 +/- 0.0874 3 197